Esta es la historia de como un problema farragoso provoca un solución informática que además de funcionar resulta un tanto divertida.
Hace un año tuve el desafortunado incordio de tener que calcular la capacidad de una glorieta. Para colmo el informe del cálculo urgía. Había que desempolvar los apuntes. Evidentemente resultaron incomprensible. Me armé de valor y empecé a googlear buscando soluciones en Internet.
Al tiempo me dispuse a ver de qué datos disponía. Uno de los datos, más o menos fácil de encontrar fueron los aforos. Había carreteras cercanas cuyos aforos estaban disponibles. Muchas Administraciones cuelgan de la red este tipo de datos. El primer problema era que los aforos son suma de las dos direcciones de la carretera. La primera incógnita resultó ser cuanto tráfico tenía cada sentido en cada carretera.
Otro dato del que disponía era la propia geometría de la glorieta, en mi caso, 50 metros de diámetro interior y dos carriles.
Otro dato era la progresión de crecimiento anual. Este dato se suele extrapolar del histórico de aforos. En nuestro caso, debido a la crisis resultaba negativo. Por ello no se podría usar.
This is the story of as a cumbersome problem causes a software solution that besides functioning is somewhat amusing.
A year ago I had the unfortunate pain in the ass of having to calculate the capacity of a roundabout. To make matters worse the report was urgent _. I had to dust off the notes of the faculty. Evidently they were incomprehensible. I overcame and started googling for solutions on the Internet.
At the time I started to see what data available. One of the data, more or less easy to find were the vehicle-flows. There were roads near in which flow were available. Many administrations hang of this type of data network. The first problem was that the flows are the sum of both directions of the road. The first unknown how much traffic was proved each direction on each road.
Other data available was the geometry of the roundabout, in my case, 50 m inner diameter and two lanes.
Another point was the progression of annual growth. This data is often extrapolated from historical traffic counts. In our case, due to the crisis was negative. Therefore it could not use.
Y... ya está no hay más datos.
A partir de este momento había que consultar la bibliografía existente:
Se dispone de los datos de I30 e I150, es decir la Intensidad horaria (medida en vehículos/hora) en los 30 y 50 minutos de hora punta respectivamente. A partir de ahí podemos buscar formulaciones o ser un poco original correlacionando 30 con I30, 150 con I150, y después deducir I60. Se aconseja leer artículos como éste: http://sirio.ua.es/proyectos/manual_%20carreteras/01020204.pdf
El paso siguiente es la proyección del tráfico. Lo mejor será suponer que el crecimiento del parque automovilístico de la zona será parecido al crecimiento económico. Podemos poner un 2% anual (esperemos que salgamos de la crisis)
Más tarde tendremos que estudiar a autores como A.J. Crayon y el "Highway Capacity Manual"
And ... that's it no more data.
From this moment had to consult the literature:
It has data I30 e I150, ie the time intensity (measured in vehicles / hour) in the 30 and 50 minute peak hour respectively. From there we can find formulations or be an unoriginal correlating 30 with I30 ,150 with I150, and then deduct I60. . We suggest reading articles like this: http://sirio.ua.es/proyectos/manual_%20carreteras/01020204.pdf
The next step is the projection of traffic. It would be best to assume that the growth in the car park area will be similar to economic growth. We can put a 2% annual (hopefully out of the crisis)
Later we must study authors like AJ Crayon and the "Highway Capacity Manual"
 |
| Resumen de niveles de servicio Summary service levels |
Un planteamiento podría hacerse a través de las “Recomendaciones sobre glorietas (1989, Ministerio de Obras Públicas y Urbanismo) posteriormente revisada en el año 1999 por el Ministerio de Fomento.
El procedimiento descrito en dichos documentos de referencia es el siguiente:
– Calcular una relación entre la capacidad de cada entrada y la intensidad prioritaria que corta. (método inglés)
– Establecer un proceso iterativo de equilibrio entre todas la intensidades de entrada.
Una vez calculados estos valores, se determina la demora asociada a cada ramal, dato sobre el cual se clasifica el nivel de servicio. El nivel de servicio resultante será el dado por el peor de los ramales.
One approach could be done through the “Recomendaciones sobre glorietas (1989, Ministerio de Obras Públicas y Urbanismo) subsequently revised in 1999 by the Ministerio de Fomento.
The process described in these reference documents are as follows:
- Calculate a ratio between the capacity of each entry and the primary cutting intensity. (English method)
- Establish an iterative process of balancing all the input currents.
Once these values calculated, the delay associated with each branch, data on which the service level is classified is determined. The resulting level of service is given by the worst of the branches.
 |
| Niveles de servicio por tiempo de demora Levels of service for time delay |
Según Raffaele Mauro, las demoras en intersecciones construidas a lo largo de una vía contribuyen a la pérdida de tiempo durante un viaje, pudiéndose representar las variables de la demora debida a la presencia de una glorieta en una vía de la siguiente manera:
According Raffaele Mauro, delays at intersections built along a pathway contributing to the loss of time while traveling, being able to represent the variables of the delay due to the presence of a gazebo in a way as follows:
According Raffaele Mauro, delays at intersections built along a pathway contributing to the loss of time while traveling, being able to represent the variables of the delay due to the presence of a gazebo in a way as follows:
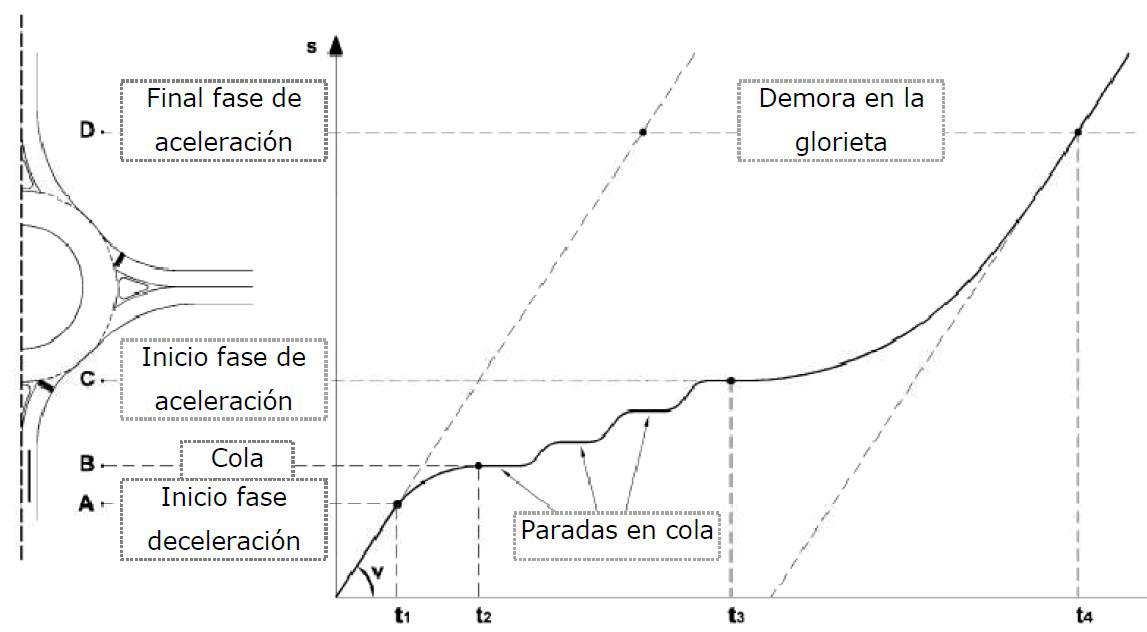
En la siguiente figura se presenta un diagrama tiempo-distancia simplificado que debería reemplazar el diagrama anterior para poder evaluar las demoras:
The following figure shows a simplified time-distance diagram should replace the above diagram to evaluate delays occur:
The following figure shows a simplified time-distance diagram should replace the above diagram to evaluate delays occur:
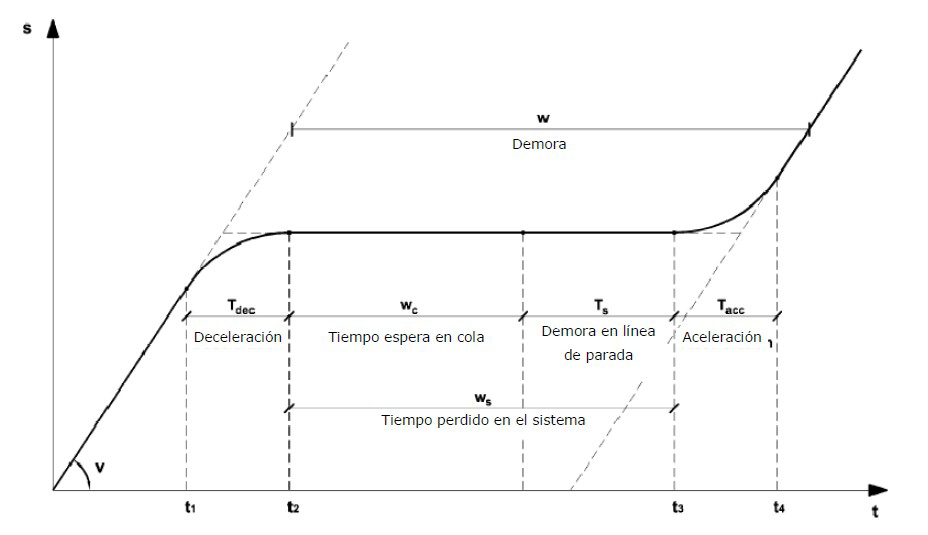
Siendo la variable ws la que indica el tiempo perdido en el sistema o la demora del vehículo en términos de ingeniería del tráfico; wc es el tiempo de espera en cola, es decir, el tiempo que un vehículo pierde desde el
momento en que se une a la cola hasta que alcanza el primer puesto en la misma (en línea de ceda el paso); por tanto, el tiempo Ts es el tiempo desde el momento en que el vehículo alcanza el primer puesto en la cola
(línea de ceda el paso) hasta que se incorpora a la circulación anular.
Estas demoras, al igual que la capacidad, pueden calcularse con métodos analíticos y con empíricos.
Ws variable which indicates the time lost in the system or the delay of the vehicle in terms of traffic engineering; wc is the queuing time, ie the time that a vehicle loses from
time join the queue until it reaches the first position in the same (in line give way); therefore, the time Ts is the time from when the vehicle reaches the first position in the queue
(give way line) until it joins the annular flow.
These delays, as capacity, can be calculated by analytical and empirical methods.
La demora es un parámetro estándar utilizado para medir el funcionamiento de una intersección. El Manual de Capacidad de carreteras (Highway Capacity Manual, HCM) identifica la demora como la primera medida de la efectividad tanto de las intersecciones semaforizadas como de las no semaforizadas, determinando su nivel de servicio dado un valor estimado de la demora. El HCM considera la demora como la suma del tiempo que un conductor gasta en la cola y el tiempo que gasta al frente de la cola esperando un hueco aceptable para entrar a la intersección. La fórmula para calcular esta demora es:
Delay is a standard parameter used to measure the performance of an intersection. Capacity Manual highway (Highway Capacity Manual, HCM) identifies delay as the first measure of the effectiveness of both signalized intersections and unsignalized of determining your level of service as an estimate of the delay value. The HCM delay considered as the sum of the time a driver spends in the queue and the time you spend in front of the queue waiting for an acceptable gap entering the intersection. The formula for calculating this delay is:

Donde:
- d demora media (s/vh)
- v x tasa para el movimiento x (vh/h)
- c m x , capacidad para el movimiento en x(vh/h)
- T período de análisis (h)
- d average delay (s / vh)
- v x rate for x (vh / h) movement
- c m x, capacity for movement in x (vh / h)
- T analysis period (h)

El resultado, después de entender todo esto (se tarda), es un informe muy sesudo, totalmente críptico. Nada intuitivo y muy difícil de explicar. En caso de desacuerdo, la parte en discordia tendrá otro tocho similar y será muy difícil dilucidar quien lleva razón.
Por otro lado éste es el método académico.
The result, after understanding all this (takes), is a very sensible report totally cryptic. Nothing intuitive and very difficult to explain. In case of disagreement, the party will have a similar billet discord and will be very difficult to decide who is right.
On the other hand this is the academic method.
Otro método /Other method
Pero hay otro método. Para el cual nos debe gustar programar un poco. La idea es ver que los coches se desplazan, se estorban y producen demoras. Hasta llegar al total de vehículos a medir y sencillamente se tratará de comparar los tiempos de espera.
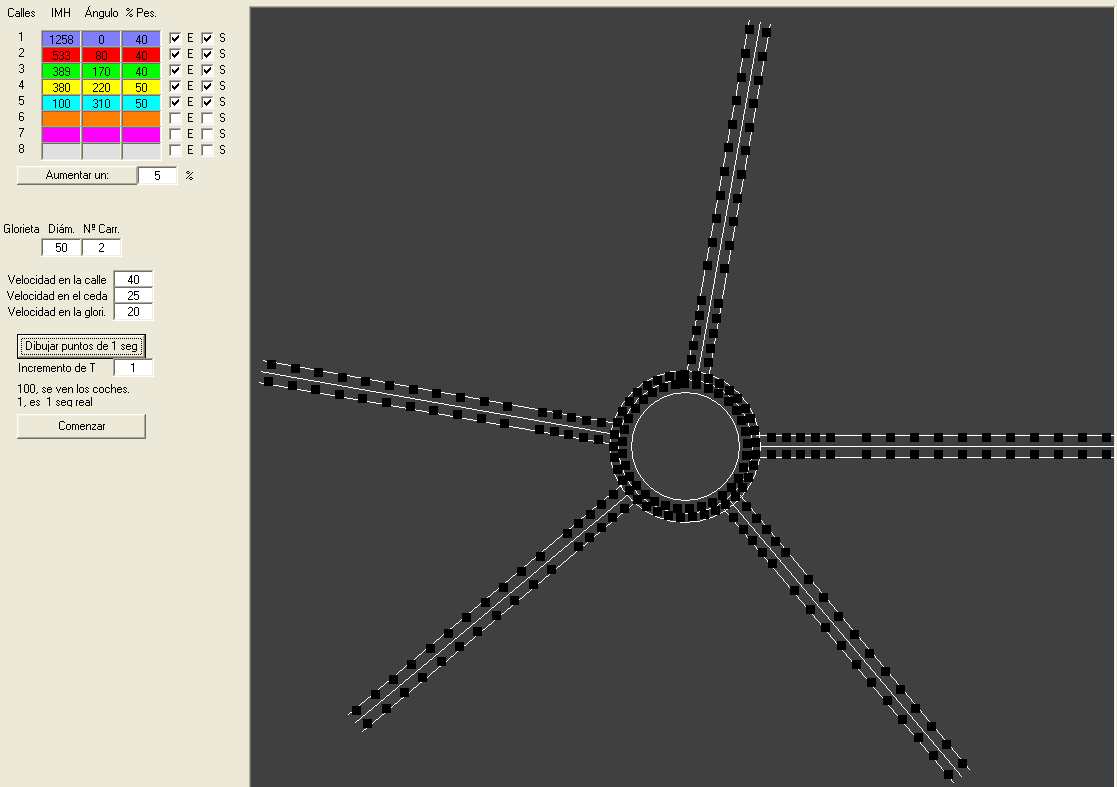
Para hacer nuestro programa vamos a suponer con esta variables de entrada:
- Hasta 8 viales conectables a la glorieta
- Una intensidad de tráfico para cada uno de ellos
- Un porcentaje de vehículos pesados
- Un ángulo con respecto al primer ramal (éste primero puede ser 0º)
- Una especificación de si el ramal es de una o dos direcciones especificando el sentido.
- Diámetro interior de la glorieta
- Número de carriles de la glorieta
- Velocidad que tiene cada calle
- Velocidad reducida de aproximación a la glorieta
- Velocidad reducida en la glorieta
Para las velocidades los valores más acertados suelen ser de 40, 25, 20 para glorietas de más de 20 m de diámetro, hasta 40, 15, 10 para glorietas menores de 10 metros de diámetro interior.
But there is another method. To which we should like to schedule a bit. The idea is to see which cars are moved, become clogged and cause delays. To reach the total of vehicles simply measure and will try to compare waiting times.
To make our program we will assume this input variables:
For the most accurate speed values are usually 40, 25, 20 for Bowers over 20 m in diameter, up to 40, 15, 10 for roundabouts under 10 feet inside diameter.
But there is another method. To which we should like to schedule a bit. The idea is to see which cars are moved, become clogged and cause delays. To reach the total of vehicles simply measure and will try to compare waiting times.
To make our program we will assume this input variables:
- Up to 8 plug vials at the roundabout
- A traffic intensity for each
- A percentage of heavy vehicles
- An angle to the first branch (it first can be 0 °)
- A specification of whether the branch is in one or two directions specifying the direction.
- Inner diameter of the roundabout
- Number of lanes on the roundabout
- Speed that each street
- Reduced speed of approach to the roundabout
- Reduced speed in the roundabout
For the most accurate speed values are usually 40, 25, 20 for Bowers over 20 m in diameter, up to 40, 15, 10 for roundabouts under 10 feet inside diameter.
 |
| Aspecto de la entrada de datos (es un ejemplo) Aspect of the input (an example) |
El siguiente paso es el dibujo y nos preguntamos como se moverán los vehículos. La solución la hacemos también sencilla, darán saltos de 1 segundo. Para ello crearemos casillas a 1 segundo de distancia. De esta manera cada vez que pase un segundo darán un saltito unidad a la casilla siguiente. Evidentemente, los camiones, tardarán algo más de un segundo en saltar.
Dibujando:
The next step is drawing and wonder how the vehicles are moved. The solution we also simple, they will jump 1 second. This will create boxes 1 second away. Thus every time you pass one second give a little jump drive to the next box. Obviously, the trucks will take more than a second jump.
Drawing:
The next step is drawing and wonder how the vehicles are moved. The solution we also simple, they will jump 1 second. This will create boxes 1 second away. Thus every time you pass one second give a little jump drive to the next box. Obviously, the trucks will take more than a second jump.
Drawing:
 |
| Puntos de salto a un segundo en una glorieta con 5 ramales |
El siguiente paso es el establecimiento de rutas:
The next step is the establishment of routes:
The next step is the establishment of routes:
Continúa en: / Continue on: http://carreteras-laser-escaner.blogspot.com/2014/11/calculating-capacity-roundabouts-ii.html
Me podrías decir qué programa es el que calcula la capacidad de la gorieta y cómo lo puedo obtener?
ResponderEliminarMuchas gracias.
El programa de éste artículo está realizado en VB. Pero con el mismo algoritmo de cálculo está disponible en Android gratuitamente en Google-Play
Eliminar