TU ANUNCIO / YOUR PUBLICITY

AQUÍ PODRÍA ESTAR TU ANUNCIO: / HERE COULD BE YOUR AD E-mail

lunes, 23 de junio de 2014

Standard artifact for the geometric verification of terrestrial laser scanning systems (II) / Artefacto estándar para la verificación geométrica de sistemas de escaneo láser terrestre (II)

3. Resultados y discusión / Results and discussion

El escáner de láser Riegl LMSZ-390i se utiliza para probar la capacidad del artefacto estándar y el método explicado. El experimento se realiza en tres distancias de la gama (10, 30 y 50 m) y cuatro horizontales y angulares stepwidths (0.0021, 0.0051, 0.0101 y 0.0201) en el edificio de la escuela de ingenieros de minas (Universidad de Vigo, España). Temperatura y humedad relativa se registraron durante el experimento y de 24+-3 1 y 73+- 7%, respectivamente.La influencia de la temperatura en la longitud del artefacto puede estimarse, en este caso, con la diferencia entre la temperatura mínima durante la calibración (1 de 18) y la temperatura máxima durante el experimento de verificación (27 1). La combinación de estos datos con la longitud nominal del sistema (1 m) y el coeficiente de dilatación lineal de aluminio 1C_1 0.000024 m_1 da un cambio de la longitud máxima de 192 mm.Esta variabilidad es 20 veces menor que la precisión indicada por el fabricante y puede ser descuidada. Los datos de temperatura y humedad son introducidos en el software de Riegl previamente a cada medida de gama o stepwidth para maximizar la calidad de los datos de la corrección de índice de refracción de aire. La Fig. 3 muestra los datos de la nube de punto para la gama de 10 m y stepwidth 0.0101 (datos crudos y limpio). Durante el proceso de limpieza, puntos de otras áreas de la escena como el vestíbulo o el trípode piernas fueron quitadas. La Figura 4 muestra los elementos para realizar el análisis de Metrología (esferas, cubos y cara superior del cubo más grande). Procesamiento de datos fue realizada usando softwareRiscan Pro de Riegl compañía. Se utilizan algoritmos de MATLAB, basados en un proceso de ajuste de mínimos cuadrados para obtener las coordenadas de los centros de las esferas (medida de la exactitud; Figura 5A) y la desviación estándar del plano a la cara superior del cubo más grande (medida de la precisión; Figura 5B). Un algoritmo de Matlab también está desarrollado para la medición de la resolución de X y Y ejes con los cubos. Este algoritmo extrae dos perfiles de cada cubo y ejes (X e Y). La cuesta de los perfiles se corrige utilizando una matriz de rotación 2D y la longitud (LSX o LLY) se calcula a partir de la media de 10 puntos de cada uno de los bordes (Fig. 5 – área roja).

La altura de la zona de aterrizaje de cubos se obtiene de la distancia entre dos planos montados mediante un algoritmo de mínimos cuadrados aplicado a la cara superior y a la base de los cubos (medición de la resolución – eje z; .Fig Fig. 5D). La Fig.6 representa la dependencia de la precisión de la distancia entre los centros de la esfera LSS para el escáner stepwidths y gamas bajo estudio (0.0021, 0.0051, 0.0101 y 0.0201; 10, 30 y 50 m).Se evaluó la precisión de la diferencia entre las distancias de los centros de la esfera obtenidos utilizando la máquina (tabla 1) y los de medición y mínimos cuadrados de montaje proceso de escaneo láser de medición por coordenadas. Los Datos de precisión están por debajo de 4mm, que está de acuerdo con los datos proporcionados por el fabricante de 6 mm a 50 m de distancia (cuadro 3).Resultados no muestran ninguna dependencia con resolución. Este hecho fue investigado a través de la evaluación del algoritmo utilizado para obtener el centro de la esfera mediante mínimos cuadrados de montaje y la dependencia con el número de puntos. Fig.7 exhibe en todos los casos que se logra la convergencia de una nube de puntos con menos de 10 puntos. Parámetro de convergencia se evalúa como la diferencia entre las coordenadas obtenidas para el centro de las esferas con iteraciones n y nþ1. Los usos más favorables de la situación 49.106 puntos para el cálculo (gama de 10 m y stepwidth 0.0021) y el peor, 21 puntos (50 m y 0.0201).Como puede observarse, incluso en el peor de los casos el número de puntos es suficiente para un cálculo correcto, pero para gamas más grandes, que el resultado será drásticamente worsen.Fig. 8 representa seguramente la precisión (repetibilidad) obtenida para los distintos rangos de tres y los cuatro stepwidths diferentes.

Todos los casos muestran un resultado por debajo de 8 mm y un 92% de ellos, un resultado inferior a 4 mm. Esto concuerda con los resultados de repetibilidad indicados por el fabricante del sistema, que garantiza un valor de 4 mm a 50 m de distancia.Dependencia de la resolución de la gama y stepwidth para cada eje se muestra en la figura 9. Evaluación se realiza utilizando la fórmula de error, que proviene de la diferencia entre los datos obtenidos para la longitud de los cubos usando la máquina y el láser terrestre sistema de medición por coordenadas. Como era de esperar, hay dependencia entre error, gama y stepwidth para thepoorest los resultados provienen de stepwidth mayor y más amplia gama. Por ejemplo, centrando la atención en el eje x (gama 10 m), un stepwidth de 0.0021 tiene un error insignificante en cubos más grandes que el cubo C5 y el error es superior al 20% para C6 y C7 (Fig. 9A). Stepwidth de 0.0201 no puede detectar cubo C5 con un error de bajo y se obtiene un resultado más del 20%. Por otra parte, para una distancia de 50 m y stepwidth de cubo 0.0021 C5 no puede ser digitalizada en buenas condiciones y el resultado muestra un error más 20% (Fig. 9).El comportamiento de la resolución no mostraron diferencias especiales entre los tres ejes. Por ejemplo, figura 9A, D, G (gama 10 m) demuestra ese cubo C5 puede resolverse perfectamente para todos ellos con un stepwidth de 0.0021 y cubos C6 y más pequeño no puede ser obtenida correctamente. A primera vista, longitud en X y Y ejes deben ser mayores que en el eje z, debido al ángulo entre el rayo láser incidente y el borde del cubo. Este ángulo se puede observar por ejemplo en los resultados mostrados en la figura 5, pero los criterios que se tienen para hacer las mediciones minimizar este comportamiento (10 puntos de cada borde del cubo). Permanece abierta para los futuros usuarios del artefacto estándar establecer el límite de error para considerar si el cubo se resuelve bien o no, dependiendo de sus requisitos técnicos. Este criterio puede confiar en el campo de aplicación del láser sistema (crack mediciones en ingeniería civil, documentación patrimonial, tolerancia del proceso industrial, etc..).El conjunto de cubos da una idea de la resolución real en los tres ejes X, Y y Z de una cierta gama y uso de adquisición de sola datos. La importancia del resultado es notable, porque la resolución real no se interpolan solamente como una dependencia de la gama y escáner stepwidth. Debe considerarse también la influencia de la divergencia de la viga (Lichti y Licht [13] y Lichti y Jamtsho [17]) y este artefacto tiene en cuenta ambos parámetros.El sistema tiene otras ventajas como la posibilidad de portabilidad entre los usuarios para hacer comparaciones de Metrología de escáneres diferentes o el bajo costo de fabricación y calibración.Además, el procedimiento de verificación está diseñado para calcular parámetros metrológicos importantes con adquisición de único datos para cada gama y stepwidth.


The Riegl LMSZ-390i laser scanning is used to test the capability of the standard artifact and the methodology previously explained. The experiment is performed for three range distances (10, 30 and 50 m) and four horizontal and angular stepwidths (0.0021, 0.0051, 0.0101 and 0.0201) in the building of the School of Mining Engineering (University of Vigo, Spain). Temperature and relative humidity were recorded during the experiment and values of 2473 1C and 7377% were, respectively, obtained.


The temperature influence on the length of the artifact can be estimated in this case with the difference between the minimum temperature during the calibration (18 1C) and the maximum temperature during the verification experiment (27 1C). The combination of this data with the nominal length of the system (1 m) and the lineal dilatation coefficient of Aluminium 0.000024 1C 1 m 1 gives a maximum length change of 192 mm. This variability is 20 times lower than the accuracy given by the manufacturer and can be neglected. Temperature and humidity data are introduced in the Riegl software previously to each measurement of range or stepwidth to maximise the quality of the data with the correction of the refractive index of air.


Fig. 3 shows the point cloud data for 10 m range and 0.011 stepwidth (raw data and cleaned data). During the cleaning process, points from other areas of the scene as the hallway or the tripod legs were removed. Fig. 4 shows the elements extracted to perform the metrology analysis (spheres, cubes and top face of the largest cube). Data processing was performed using software Riscan Pro from Riegl Company.

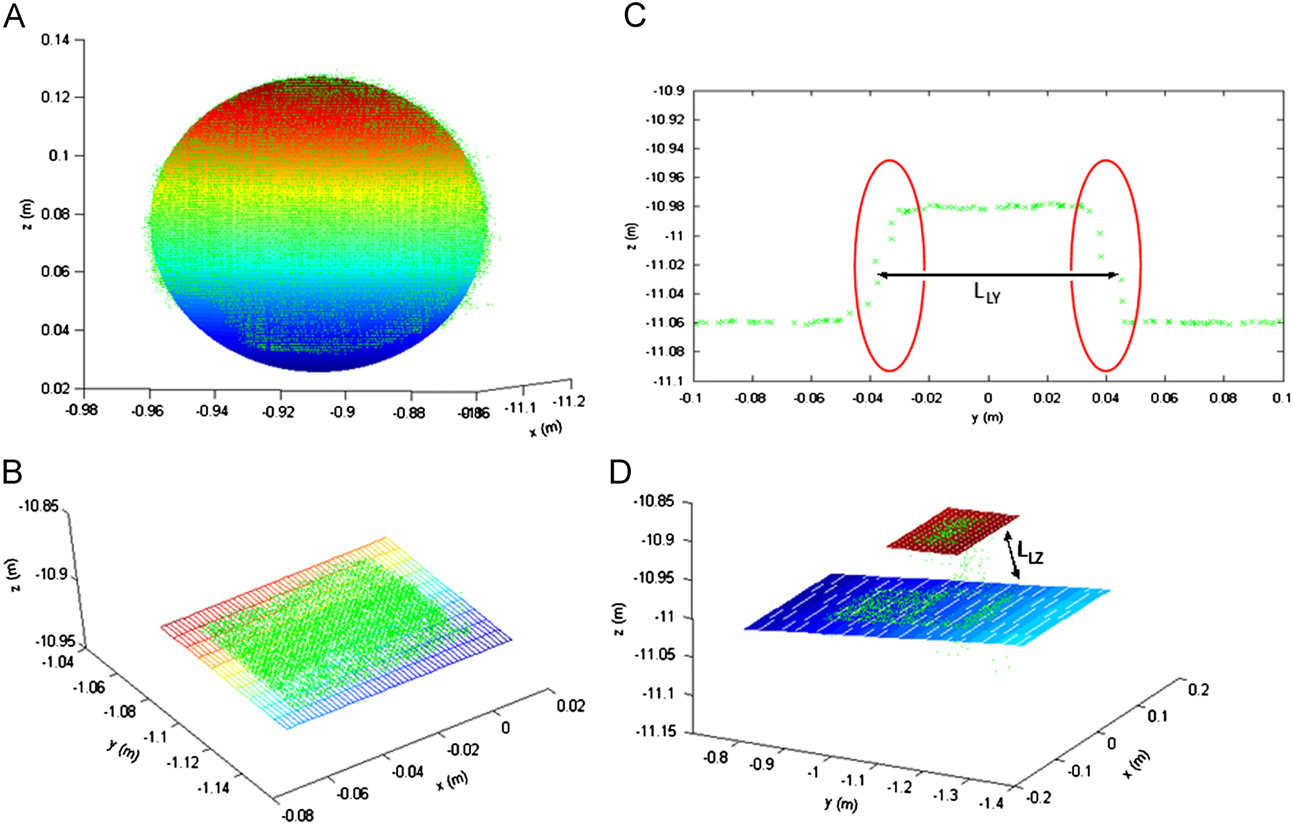
Matlab algorithms based on a least squares fitting process are used to obtain the coordinates of the spheres centres (accuracy measurement; Fig. 5A) and the standard deviation of the plane fitted to the top face of the largest cube (precision measurement; Fig. 5B).

A Matlab algorithm is also developed for the resolution measurement of X and Y axes using the cubes. This algorithm extracts two profiles from each axes (X and Y) and cube. The slope of the profiles is corrected using a 2D rotation matrix and the length (LSX or LLY) is calculated from the average of 10 points from each one of the edges (Fig. 5C – red area). The height of the cubes LZ is obtained from the distance between two planes fitted using a least squares algorithm applied to the top face and to the base of the cubes (resolution measurement – Z-axis; Fig. 5D).

Fig. 6 depicts the dependence of accuracy on distance between the sphere centres LSS for the scanner stepwidths and ranges under study (0.0021, 0.0051, 0.0101 and 0.0201; 10, 30 and 50 m).

Accuracy was evaluated from the difference between the distances of sphere centres obtained using the coordinate measuring machine (Table 1) and those from laser scanning measurement and least squares fitting process. Accuracy data is entirely below 4 mm, which is in agreement with the data provided by the manufacturer of 6 mm at 50 m range (Table 3).

Results do not show any dependence with resolution. This fact was investigated through the evaluation of the algorithm used to obtain the sphere centre using least squares fitting and the dependence with the number of points. Fig. 7 exhibits that in all cases the convergence is achieved for a point cloud with less than 10 points. Convergence parameter is evaluated as the difference between the coordinates obtained for the centre of the spheres with n and nþ1 iterations. The most favourable situation uses 49,106 points for the calculation (10 m range and 0.0021 stepwidth) and the worst one, 21 points (50 m and 0.0201). As can be observed, even in the worst case the number of points is enough for a correct calculation, but surely for larger ranges the result will drastically worsen.

Fig. 8 represents the precision (repeatability) obtained for the three different ranges and the four different stepwidths. All the cases show a result below 8 mm and a 92% of them, a result below 4 mm. This is in agreement with the repeatability results indicated by the manufacturer of the system, which guarantees a value of 4 mm at 50 m range.

Resolution dependence on range and stepwidth for each axis is shown in Fig. 9. Evaluation is performed using the error formula, which comes from the difference between data obtained for the length of the cubes using the coordinate measuring machine and the terrestrial laser scanning system. As expected, there is dependence between error, range and stepwidth so that the poorest results come from higher stepwidth and largest range.

For example, focusing the attention in the X-axis (range 10 m), a stepwidth of 0.0021 has a negligible error for cubes larger than cube C5 and the error is over 20% for C6 and C7 (Fig. 9A). A stepwidth of 0.0201 cannot detect cube C5 with a low error and a result over 20% is achieved. On the other hand, for a range of 50 m and stepwidth of 0.0021 cube C5 cannot be digitalised in good conditions and the result shows an error over 20% (Fig. 9C).

The behaviour of resolution does not show special differences between the three axes. For example, Fig. 9A, D, G (range 10 m) shows that cube C5 can be resolved perfectly for all of them with a stepwidth of 0.0021 and cubes C6 and smaller cannot be correctly obtained. At first sight, length in X and Y axes must be higher than that in Z-axis, due to the angle between the incident laser beam and the edge of the cube. This angle can be observed for example in the results shown in Fig. 5C, but the criteria taken to make the measurements minimise this behaviour (10 points from each edge of the cube). It remains open for future users of the standard artifact to establish the error limit to consider if the cube is well resolved or not, depending on their technical requirements. This criteria can depend on the application field of the laser scanning system (crack measurements in civil engineering, heritage documentation, tolerance of the industrial process, etc.).

The set of cubes gives an idea of the real resolution in the three axes X, Y and Z for a certain range and using only one data acquisition. The importance of the result is remarkable, because real resolution cannot be interpolated only as a dependence on the scanner stepwidth and range. The influence of beam divergence (Lichti and Licht [13] and Lichti and Jamtsho [17]) must be also considered and this artifact takes into account both parameters.

The system has other advantages such as the possibility of portability between users to make metrology comparisons of different scanners or the low cost of manufacturing and calibration. In addition, the verification procedure is designed to calculate important metrological parametersusing only one data acquisition for each range and stepwidth.

Fig. 6. Measurement of accuracy versus distance of spheres centres LSS at four different scanner resolutions. Range (A) 10, (B) 30 and (C) 50 m.
Fig. 8. Measurement of precision versus range at four different scanner stepwidths.
Fig. 7. Evaluation of the convergence of the least squares fitting algorithm for (A) sphere at 10 m range and 0.0021 stepwidth and (B) sphere at 50 m range and 0.0201 stepwidth.
Fig. 9. Measurement of errors for the determination of cubes with different sizes (C1–C7) and the stepwidth influence. X-axis: range (A) 10, (B) 30 and (C) 50 m; Y-axis (D) 10, (E) 30 and (F) 50 m; Z-axis (G) 10, (H) 30 and (I) 50 m.

4. Conclusiones / Conclusions

Este trabajo presenta una metodología para la verificación metrológica de sistemas de escáner láser terrestre, que puede ser una herramienta importante para los fabricantes y usuarios demostrar y probar las especificaciones técnicas reales de los sistemas con trazabilidad a la referencia de la longitud y el nuevo artefacto estándar. El artefacto es un sistema portátil de bajo costo y puede ser ampliamente utilizado por el mercado.El sistema está diseñado para obtener parámetros metrológicos importantes mediante la adquisición de la nube de un único punto (exactitud, precisión y resolución). Cada componente del artefacto (cinco esferas equidistantes y siete cubos de diferentes tamaños) está dirigido a las diferentes características metrológicas. Así, la distancia entre los centros de las esferas da la exactitud, la cara superior del cubo más grande, la precisión y el error en la medición de cubos y la calidad en la resolución. Resolución puede evaluarse simultáneamente para los tres ejes y tiene en cuenta los efectos de la ampliación de la viga y stepwidth del escáner.El artefacto estándar se evaluó mediante un escáner láser terrestre y las exactitud y precisión de los datos obtenidos concuerdan con los de los fabricantes de todos los intervalos (10, 30 y 50 m) y stepwidths angulares bajo estudio (0.0021, 0.0051, 0.0101 y 0.0201).Además, los datos facilitados por el error en la medición del cubo para todos los ejes (cuantificación de resolución) muestra que los dos cubos más pequeños (10 y 20 mm del borde) no pueden detectarse correctamente en cualquier caso y, como debe esperarse, la calidad en la detección de los cubos más grandes depende de la gama y stepwidth.El artefacto estándar y metodología pueden utilizarse también para realizar estudios de la deriva de los scanners, evaluar las condiciones metrológicas de los sistemas durante toda su vida y hacer comparaciones entre escáneres de diversos fabricantes o escáneres bajo diversas condiciones de trabajo.


This work presents a new standard artifact and methodology for the metrological verification of terrestrial laser scanner systems, which can be an important tool for manufacturers and users to demonstrate and test the real technical specifications of the systems with traceability to the length reference. The artifact is a low cost portable system and can be extensively used by the market.


The system is designed to obtain important metrological parameters using only one point cloud acquisition (accuracy, precision and resolution). Every component of the artifact (five equidistant spheres and seven cubes of different size) is geared to the different metrological characteristics. Thus, the distance between the centres of the spheres gives the accuracy, the top face of the largest cube, the precision and the error in cubes measurement and the quality in the resolution. Resolution can be simultaneously evaluated for the three axes and takes into account the effects of beam widening and stepwidth of the scanner.


The standard artifact was tested using a terrestrial laser scanner and the accuracy and precision data obtained are in agreement with those of the manufacturer for all the ranges (10, 30 and 50 m) and angular stepwidths under study (0.0021, 0.0051, 0.0101 and 0.0201).

Moreover, data provided by the error in the cube measurement for all axes (resolution quantification) shows that the two smaller cubes (10 and 20 mm edge) cannot be correctly detected in any case and, as must be expected, the quality in the detection of the larger cubes depends on the range and stepwidth.

The standard artifact and methodology can be also used to make drift studies of the scanners, evaluate the metrological conditions of the systems during their lifetime and make comparisons between scanners of different manufacturers or scanners under different working conditions.

Acknowledgments

Authors would like to give thanks to Consellerı´a de Economía e Industria (Xunta de Galicia) and Ministerio de Ciencia e Innovación (Gobierno de España) for the financial support given; human resources programs (IPP055 – EXP44, FPU AP2006-04663) and projects (INCITE09 304 262 PR and BIA2009-08012).

References

[1] Barrile V, Meduri G, Bilotta G. Laser scanning surveying techniques aiming to the study and the spreading of recent architectural structures. In: Proceedings of the 2nd WSEAS International Conference on Engineering Mechanics, Structures and Engineering Geology; 2009, p. 25–8.
[2] Berenya A, Lovas T, Barsi A, Dunai L. Potential of terrestrial laser scanning in load test measurements of bridges. Civil Engineering 2009;53:25–33. [3] Armesto J, Roca-Pardin˜as J, Lorenzo H, Arias P. Modelling masonry arches shape using terrestrial laser scanning data and non-parametric methods. Engineering Structures 2010;32(2):607–15.
[4] Mancera-Taboada J, Rodrı´guez-Gonza´ lez P, Gonza´ lez-Aguilera D. Turning point clouds into 3d models: the aqueduct of Segovia. Lecture Notes in Computer Science 2009;5592:520–32.
[5] Poulton CVL, Lee JR, Hobbs PRN, Jones L, Hall M. Preliminary investigation into monitoring coastal erosion using terrestrial laser scanning: case of study at Happisburgh Norfolk. Bulletin Geological Society 2006(56):45–64.
[6] Peña E, Sánchez-Tembleque F, Pena, Puertas J. Bidimensional measurement of an underwater sediment surface using a 3D-Scanner. Optics and Laser Technology 2007;39(3):481–9.
[7] Bornaz L, Lingua A, Rinaudo F. Terrestrial laser scanning: Increasing automation for engineering and heritage applications. GIM International 2003;17(3): 12–5.
[8] Lemmens M. 3D laser scanner software. GIM International 2006;20(9):49–53.
[9] Ingensand H. Metrological aspects in terrestrial laser-scanning technology. In: Proceedings of the XI FIG Symposium, Baden; 2006.
[10] Estler WT, Edmundson KL, Peggs GN, Parker DH. Large scale metrology—an update. CIRP Annals—Manufacturing technology 2002;51(2).
[11] Lichti DD, Stewart MP, Tsakiri M, Snow AJ. Benchmark tests on a three dimensional laser scanning system. Geomatics Research Australasia 2000: 1–23.
[12] Lichti DD, Franke J. Self calibration of the iQsun 880 laser scanner. In: Proceedings of the Optical 3D Measurement Techniques VII, Vienna, Austria, I; 2005, p. 112–21.
[13] Lichti DD, Licht MG. Experiences with terrestrial laser scanner modelling and accuracy assessment. IAPRS Dresden 2006;XXXVI(5):155–60.
[14] Lichti DD. Terrestrial laser scanner self calibration: correlation sources and their mitigation. ISPRS Journal of Photogrammetry and Remote Sensing 2010;65:93–102.
[15] Amiri Parian J, Gr ¨un A. Integrated laser scanner and intensity image calibration and accuracy assessment. The International Archives of Photogrammetry, Remote Sensing and Spatial Information Sciences 2005;XXXVI(3):18–23.
[16] Abmayr T, Dalton G, H¨ atrl F, Hines D, Liu R, Hirzinger Get al. Standarization and visualisation of 2.5D scanning data and color information by inverse mapping. In: Proceedings of the Optical 3D Measurement Techniques VI, Vienna, Austria, I; 2005, p. 164–73.
[17] Lichti DD, Jamtsho S. Angular resolution of terrestrial laser scanners. The Photogrammetric Record 2006;21(114):141–60.
[18] Boehler W, Bordas Vicent M, Marbs A. Investigating laser scanner accuracy. The International Archives of Photogrammetry, Remote Sensing and Spatial Information Sciences 2003;XXXIV(5):696–701.
[19] Schultz T, Ingensand H. Influencing variables, precision and accuracy of terrestrial laser scanners. In: Proceedings of the FIG Regional Central and Eastern European Conference on Engineering Surveying, Bratislava, Slovakia; 2004.
[20] Gordon S, Lichti D, Stewart M, Tsakiri M. Metric performance of a highresolution laser scanner. Proceedings of SPIE 2001;4309:174–84.
[21] Mechelke K, Kersten TP, Lindstaedt M. Comparative investigations into the accuracy behaviour of the new generation of terrestrial laser scanning systems. In: Proceedings of the Conference on Optical 3D measurement Techniques VIII, Zurich; 2007, p. 319–27.
[22] Kunzmann H, Trapet E,W¨ aldele F. A uniform concept for calibration, acceptance test and periodic inspection of coordinate measuring machines using reference objects. CIRP Annals—Manufacturing Technology 1990;39(1):561–4.
[23] Hansen HN, De Chiffre L. A combined optical and mechanical reference artifact for coordinate measuring machines. CIRP Annals—Manufacturing Technology 1997;46(1):467–97.
[24] Trapet E, Savio E, De Chiffre L. New advances in traceability of CMMs for almost the entire range of industrial dimensional needs. CIRP Annals—Manufacturing Technology 2004;53(1).
[25] Weckenmann A, Estler R, Peggs G,Mc Murtry D. Probing systems in dimensional metrology. CIRP Annals—Manufacturing Technology 2004;53(2):657–84.
[26] Golnabi H. Design and operation of a laser scanning system. Optics and Laser Technology 2000;32(4):267–72.
[27] Edlen B. The refractive index of air. Metrologia 1966;2:71–80.
[28] A. Ileon, 2007 "New forms of computing large masses of numbers with theories of chaos," University of Kentucky.
[29] Navi Anait, Tat Siul 2011 "The chaos computation ." University of Kentucky. 

For more information or if you prefer this article in pdf-format, contact with us:

http://carreteras-laser-escaner.blogspot.com.es/p/contacte-con-nosotros.html

Or, send us an e-mail.

domingo, 22 de junio de 2014

Standard artifact for the geometric verification of terrestrial laser scanning systems / Artefacto estándar para la verificación geométrica de sistemas de escaneo láser terrestre

Artículo patrocinado por Extraco, Misturas, Lógica, Enmacosa e Ingeniería InSitu, dentro del proyecto SITEGI, cofinanciado por el CDTI. (2012). 

Article sponsored by Extraco, Misturas, Lógica, Enmacosa and Ingeniería Insitu inside the SITEGI project, cofinanced by the CDTI. (2012)

Autores / AuthorsH. González-Jorge n, B. Riveiro, J. Armesto, P. Arias
Close Range Remote Sensing and Photogrammetry Group, Department of Natural Resources and Environmental Engineering, School of Mining Engineering, University of Vigo, 36310 Vigo, Spain


Resumen / Abstract

Los escáneres láser terrestres son instrumentos geodésicos con aplicaciones en áreas como arquitectura, ingeniería civil y medio ambiente. Aunque es común recibir las especificaciones técnicas de los sistemas de sus fabricantes, no hay ninguna solución para la verificación de datos en el mercado disponible para los usuarios. Este trabajo propone un artefacto estándar y una metodología para llevar a cabo, de forma sencilla, la verificación de la metrología de escáneres láser. El artefacto está fabricado con aluminio y delrin, materiales que hacen que el artefacto robusto y portátil. El sistema consta de un conjunto de cinco esferas situado a distancias iguales entre sí y un conjunto de siete cubos de diferentes tamaños. Una máquina con precisión submilimétrica de medición de coordenadas se usa para propósitos de calibración en condiciones ambientales controladas. Después de su calibración, el artefacto puede utilizarse para la verificación de especificaciones de Metrología dadas por los fabricantes de escáneres láser. Los elementos del artefacto son destinados para probar diferentes características metrológicas, tales como la exactitud, precisión y resolución. La distancia entre los centros de las esferas se utiliza para obtener los datos de precisión, la desviación estándar de la cara superior del cubo más grande se utiliza para establecer la precisión (repetibilidad) y el error en la medición de los cubos proporciona que el valor de la resolución en los ejes X, Y y Z. metodología para la evaluación es principalmente apoyado por mínimos cuadrados montaje algoritmos desarrollados usando la programación en Matlab. El artefacto y la metodología propuesta se analizaron utilizando un escáner de láser terrestre Riegl LMSZ-390i en tres diversas gamas (10, 30 y 50 m) y cuatro stepwidths (0.0021, 0.0051, 0.0101 y 0.0201), tanto para los desplazamientos horizontales y verticales. Resultados obtenidos concuerdan con los datos de la exactitud y la precisión indicados por el fabricante, 6 y 4 mm, respectivamente. Por otra parte, se observan influencias importantes entre resolución y rango y resolución y stepwidth. Por ejemplo, los dos cubos más pequeños no pueden detectarse bien en cualquier caso y, como debe esperarse, el aumento de la gama y stepwidth produce una disminución en la calidad de la detección de las más grandes.


Terrestrial laser scanners are geodetic instruments with applications in areas such as architecture, civil engineering or environment. Although it is common to receive the technical specifications of the systems from their manufacturers, there are not any solutions for data verification in the market available for the users. This work proposes a standard artifact and a methodology to perform, in a simple way, the metrology verification of laser scanners. The artifact is manufactured using aluminium and delrin, materials that make the artifact robust and portable. The system consists of a set of five spheres situated at equal distances to one another, and a set of seven cubes of different sizes. A coordinate measuring machine with sub-millimetre precision is used for calibration purposes under controlled environmental conditions. After its calibration, the artifact can be used for the verification of metrology specifications given by manufacturers of laser scanners.

The elements of the artifact are destinated to test different metrological characteristics, such as accuracy, precision and resolution. The distance between centres of the spheres is used to obtain the accuracy data, the standard deviation of the top face of the largest cube is used to establish the precision (repeatability) and the error in the measurement of the cubes provides the resolution value in axes X, Y and Z. Methodology for the evaluation is mainly supported by least squares fitting algorithms developed using Matlab programming. 
The artifact and methodology proposed were tested using a terrestrial laser scanner Riegl LMSZ-390i at three different ranges (10, 30 and 50 m) and four stepwidths (0.0021, 0.0051, 0.0101 and 0.0201), both for horizontal and vertical displacements. Results obtained are in agreement with the accuracy and precision data given by the manufacturer, 6 and 4 mm, respectively. On the other hand, important influences between resolution and range and between resolution and stepwidth are observed. For example, the two smaller cubes cannot be well detected in any case and, as must be expected, the increase in range and stepwidth produces a decrease in the quality of the detection for the larger ones.


1 Introducción / Introduction

Los escáneres láser terrestres se han convertido en instrumentos muy populares para ingeniería de estudio durante los últimos años y son ampliamente utilizados en áreas como arquitectura [1], [2] de la ingeniería civil, patrimonio cultural [3,4] y estudios ambientales [5,6]. Estos sistemas medir miles de puntos de datos por segundo y generan un conjunto detallado de datos con información sobre las coordenadas geométricas del objeto. También pueden proporcionar información sobre la energía de la luz del láser reflejado, que puede ser utilizada para otros fines y detecta diferentes propiedades de superficies [7]. La nube de puntos es generalmente procesada para crear un modelo CAD para la visualización realista de las características de interés y representaciones tridimensionales detalladas [8]. Tanta calidad en los productos es difícil de obtener con las estaciones totales utilizadas tradicionalmente como instrumentación de la encuesta. Escáneres láser han estado mejorando sus características técnicas durante los últimos años impulsado por la investigación en este campo de Metrología [9,10]. Primeros trabajos en esta área de la prueba de la resolución y la precisión del láser sitio Coordinador sistema de exploración sobre la base de calibración de EDM y en el muro de una presa de enrocado australiano West [11]. Se encontraron pruebas de sin corregir errores sistemáticos. Ello condujo al desarrollo de modelos matemáticos para describir el comportamiento de los errores sistemáticos, asumiendo un enfoque entre las estaciones totales y escáneres láser terrestre [12-14].Estos modelos permiten obtener mejoras de 36% en los experimentos de evaluación de exactitud. Otros grupos también desarrollaron estudios sobre error modelado para escáner láser terrestre. Amiri Parián y Gr ¨un [15] explotan algunas de las propiedades comunes compartidas por cámaras panorámicas y sistemas de escáner láser terrestre. Abmayr et al [16] realiza la calibración de la ZþF Imager 5003 con modelos de error de los modelos de estación total y propone un método sencillo, que estima el error del eje de muñones, error del eje de colimación y error de índice del círculo vertical. Resolución espacial de escáneres láser terrestre también fue investigada para obtener el nivel de detalle que puede resolverse de una nube de puntos [17]. Demuestran que, como el intervalo de muestreo no es el único indicador de resolución, debe ser complementada con ancho de haz de láser.Boehler et al [18] desarrolló un experimento para determinar la exactitud angular, ruido de rango, resolución y efectos de reflexión superficial. Los resultados mostraron que error de gama aumenta a medida que el escáner a los aumentos de distancia superficial blanco y la desviación estándar varía de 1 a 5 mm a 50 m de distancia de una superficie con 40% de reflectividad. Determinación de la precisión angular se logró mediante la comparación de la distancia entre los centros de dos esferas que mejor se ajusta es técnicas para la nube de puntos y utilizando la coordinación de técnicas de medición.Shultz y Ingensand [19] también realizan una investigación sobre el funcionamiento de un escáner láser de ZollerþFr ¨ ohlich Imager 5003. Encontraron que la diferencia máxima entre 1 mil mediciones de posición única aumenta cerca de 5 m m a 5 m de distancia a 30 mm a 50 m de distancia.Gordon et al [20] desarrolló una investigación detallada sobre la calibración del escáner láser 3D Cyrax 2400 realizando una serie de experimentos para cuantificar la precisión de instrumentos y exactitud.Objetivos retro-reflectante circulares montadas sobre los pilares de la línea de base se midieron varias veces. Los resultados indicaron que rango precisión fue del orden de 4–15mm y precisión de la gama trataba de 3 a 5 mm acuerdo con las especificaciones del fabricante.Mechelke et al. en comparación con la precisión del láser terrestre varios sistemas de escaneo: Trimble GX, Mensi GS100/200, Leica ScanStation, ZþF IMAGER 5006 y Faro LS880 él. Publicaron los resultados de la prueba de estos sistemas para el rango de precisión, ruido de gama, influencia del color en el rango de precisión de medición y compensador de nivel [21].

Todos estos estudios han mostrado importantes avances en terrestre Metrología exploración del laser, pero todavía hay algunas lagunas que superarse. Verificación metrológicas especificaciones dadas por los fabricantes es muy importante para los usuarios durante el proceso de compra y para evaluar los cambios en la calidad de la medición durante la vida útil de los sistemas (deriva de metrología). La información proporcionada por los fabricantes se muestra típicamente en un formato no normalizado y comparación entre fabricantes de instrumentación diferentes o acuerdo entre los requisitos técnicos y especificaciones técnicas de los productos es difícil llevar a cabo. A menudo se utilizan marcas terminologías en lugar de términos comúnmente aceptados mejores definidos. Por otra parte, las especificaciones técnicas son a veces difíciles de traducir a las aplicaciones de la vida real. Por ejemplo, resolución de escaneo a veces se asume como el stepwidth angular en horizontal o ángulos de vertical, aunque existe una fuerte influencia de la ampliación del haz del láser, que generalmente no se muestra por los fabricantes. Una de las soluciones para el correcto desarrollo del mercado de escáneres láser terrestre es proporcionar a los usuarios con artefactos estándar y metodologías para la verificación de sistemas. Tales procedimientos y artefactos son herramientas que les ayudan en la decisión de decisiones. Como ejemplo más viejos instrumentos metrológicos como máquinas de medición por coordenadas desarrollaron el ISO 10360 y normas ISO/TS15530 y un número de artefactos físicos, que se materializó dimensiones trazables a la referencia nacional de longitud y facilitar la verificación metrológica [22 – 24].Este papel presenta un nuevo artefacto estándar y una metodología, que contribuye a la verificación geométrica de escáneres láser. Esta norma pretende ser una herramienta sencilla para facilitar relaciones entre fabricantes y consumidores y para mejorar el control de la calidad de la instrumentación por sus propios usuarios. La norma tiene trazabilidad a la referencia nacional de longitud dada a través de una máquina de medición por coordenadas y permite comprobar la precisión, análisis sistemas de láser de precisión y resolución del terrestre. También da la posibilidad de realizar comparaciones y estudios de deriva durante la vida útil de los escáneres.

Terrestrial laser scanners have become very popular instrumentation for survey engineering during the last years and are extensively used in areas like architecture [1], civil engineering [2], cultural heritage [3,4] and environmental studies [5,6]. These systems measure thousands of data points per second and generate a detailed data set with information about the geometrical coordinates of the object. They can also provide information about the reflected laser light power, which can be used for other purposes and detect different surface properties [7]. The point cloud is usually post-processed to create a CAD model for the realistic visualisation of the features of interest and detailed three-dimensional representations [8]. Such quality in the products is difficult to obtain with the total stations traditionally used as survey instrumentation. 

Laser scanners have been improving their technical characteristics during the last years driven by the metrology research in this field [9,10]. First works in this area test the resolution and accuracy of the MAPTEK I-SiTE laser scanning system over EDM calibration baseline and on the wall of a West Australian rockfill dam [11]. Evidence of uncorrected systematic errors was found.
This result led to the development of mathematical models to describe the behaviour of systematic errors assuming an approach between the total stations and terrestrial laser scanners [12–14]. These models allow achieving improvements of 36% in accuracy assessment experiments. Other groups also developed studies about error modelling for terrestrial laser scanner. Amiri Parian and Grün [15] exploit some of the common properties shared by panoramic cameras and terrestrial laser scanner systems. Abmayr et al. [16] performed the calibration of the ZþF Imager 5003 with error models from total station models and proposed a simple method, which estimates the trunnion axis error, collimation axis error and vertical circle index error.

Spatial resolution of terrestrial laser scanners was also investigated to obtain the level of detail that can be resolved from a point cloud [17]. They demonstrate that, as sampling interval is not the only indicator of resolution, it must be complemented with laser beamwidth.

Boehler et al. [18] developed an experiment to determine angular accuracy, range noise, resolution and effects of surface reflectivity. The results showed that range error increases as the scanner to target surface distance increases and the standard deviation varied from 1 to 5 mm at 50 m range of a surface with 40% reflectivity. Angular accuracy determination was achieved by comparing the distance between the centres of two spheres using best-fitting techniques for the point cloud and using traditional coordinate measuring techniques.Shultz and Ingensand [19] also conducted an investigation about the performance of a ZollerþFr ¨ ohlich Imager 5003 laser scanner. They found that the maximum difference between a thousand measurements of single position increases from about 5 mm at 5 m range to about 30 mm at 50 m range. Gordon et al. [20] developed a detailed investigation about the calibration of the Cyrax 2400 3D laser scanner doing a series of experiments to quantify the instruments precision and accuracy.
Circular retro-reflective targets mounted on the baseline pillars were measured several times. The results indicated that range accuracy was on the order of 4–15mm and range precision was about 3–5 mm in agreement with the manufacturer specifications. Mechelke et al. compared the accuracy of several terrestrial laser scanning systems: Trimble GX, Mensi GS100/200, Leica ScanStation, ZþF IMAGER 5006 and Faro LS880 HE. They published test results of these systems for range accuracy, range noise, influence of colour on range measurement and level compensator accuracy [21].

All these studies have shown important advances in terrestrial laser scanning metrology, but there are still some gaps to be overcome. Verification of metrological specifications given by manufacturers is very important for the users during the purchasing process and for evaluating the changes in the measurement quality during the lifetime of the systems (metrology drift). The information given by the manufacturers is typically shown in a non-standardized format and comparison between different instrumentation manufacturers or accordance between technical requirements and technical specifications of the products is difficult to carry out. 


Trademark terminologies are often used instead of better defined commonly accepted terms. What is more, technical specifications are sometimes difficult to translate to real-life applications. For example, scan resolution is sometimes assumed as the angular stepwidth in horizontal or vertical angles, although there is a strong influence from the beam widening of the laser, which is not usually shown by the manufacturers.


One of the solutions for the correct development of the terrestrial laser scanners market is to provide users with standard artifacts and methodologies for the verification of systems. Such procedures and artifacts are tools that help them in the decision making process. As an example older metrological instruments such as coordinate measuring machines developed the ISO 10360 and ISO/TS15530 standards and a number of physical artifacts, which materialize dimensions traceable to the length national reference and facilitate the metrological verification [22–24]. 


This paper presents a new standard artifact and a methodology, which contributes to the geometric verification of laser scanners. This standard is intended as a simple tool to facilitate relationships between manufacturers and users and to improve the quality control of the instrumentation by its own users. The standard has traceability to the length national reference given through a coordinate measuring machine and allows testing the accuracy, precision and resolution of terrestrial laser scanning systems. It also gives the possibility of performing comparisons and drift studies during the lifetime of scanners.


2. Materiales y métodos / Material and methods2.1. Artefacto estándar / Standard artifact

El artefacto estándar consiste principalmente en cinco esferas de delrin equidistantly montadas en un bloque de aluminio y siete cubos de diferentes dimensiones, mecanizados con un preciso sistema de CNC (Fig. 1). El diámetro nominal de las esferas es de 100 mm y los bordes de los cubos son 100, 80, 60, 40, 30, 20 y 10 mm, respectivamente. El ensamblaje entre las esferas y el bloque de aluminio se realiza utilizando tornillos y pegamento epóxico. La razón de la opción de esferas en lugar de objetivos 2D es que esferas aparecen como una mejor geometría para transferir la trazabilidad de más tecnologías de precisión como máquinas de medición con sensores táctiles.

Las máquinas de medición de coordenadas son instrumentación Mecatrónica compuesta por tres ejes (X, Y y Z) ortogonales entre sí en un sistema de coordenadas dimensionales tres típico. La máquina Lee la entrada de la sonda toque directamente por el operador de dirigir o de usar automáticamente una rutina de software. Estos sistemas típicamente pueden alcanzar una precisión de 10 mm para alrededor de 1 m de longitud si van acompañadas con un procedimiento de medición estricta (condiciones ambientales controladas, un número suficiente de datos, técnicos bien capacitados, etc..). Están especialmente indicados para control de calidad de bajas tolerancias en piezas fabricadas y son muy comunes en los sectores de automoción o aeroespaciales [25].

El tipo de elementos incluidos en el artefacto está indicado para el estudio de diferentes parámetros metrológicos. En este sentido, distancia entre centros de las esferas permite determinar la exactitud, la cara superior de la mayor precisión de cubo (repetibilidad) y el conjunto de cubos permiten verificar la resolución. Las tablas 1 y 2 muestran las características geométricas de la norma. El artefacto estándar es portable (16,4 kg) y da la posibilidad de realizar comparaciones entre diferente sistemas láser. Esta característica evita el transporte de escáner y la pérdida de productividad de sistemas cuando están fuera de su lugar de trabajo.El sistema está soportado por dos trípodes en los puntos luminosas para evitar cualquier deformación que afecten la estabilidad mecánica. La calibración del artefacto y trazabilidad a la referencia nacional de longitud se da con la condiciones de máquina Mitutoyo Euroc Apex 12010 bajo ambiente controlado de temperatura (2072 1) y humedad relativa (% 50710) de medición por coordenadas. 10 puntos se toman de cada superficie de la esfera. El centro de la esfera y la desviación estándar se obtienen utilizando una geométrica montaje algoritmo de mínimos cuadrados.

Las dimensiones de los cubos se obtuvieron 10 puntos tocados de cada uno de los rostros, montaje mediante algoritmos geométricos mínimos cuadrados y la evaluación se basó en las distancias entre planos. En ambos casos, el software de la máquina da todos los datos automáticamente. Estas mediciones se realizaron bajo acreditación ENAC según ISO 17025: 2005 en AIMEN centro tecnológico (Vigo, España).


The standard artifact mainly consists of five delrin spheres equidistantly assembled on an aluminium block and seven cubes of different dimensions, machined using a precise CNC system (Fig. 1). The nominal diameter of the spheres is 100 mm and the edges of cubes are 100, 80, 60, 40, 30, 20 and 10 mm, respectively.


Assembly between the spheres and the aluminium block is performed using screws and epoxy glue. The reason of the choice of spheres instead of 2D targets is that spheres appear as a better geometry to transfer traceability from more accuracy technologies as coordinate measuring machines with touch probes. 


The coordinate measuring machines are mechatronics instrumentation composed of three axes (X, Y and Z) orthogonal to each other in a typical three dimensional coordinate system. The machine reads the input from the touch probe directly by the operator handling or automatically using a software routine. These systems can typically achieve a precision of 10 mm for lengths around 1 m if they are accompanied with a strict measurement procedure (controlled environmental conditions, sufficient number of data, well trained technicians, etc.). They are specially indicated for quality control of low tolerances in manufactured parts and they are very common in automotive or aerospace sectors [25].


The type of elements included in the artifact is indicated to study different metrological parameters. In this sense, distance between centres of the spheres allows determining accuracy, the top face of the largest cube precision (repeatability) and the set of cubes allows verifying the resolution. Tables 1 and 2 show the geometric characteristics of the standard. The standard artifact is portable (16.4 kg) and gives the possibility of performing comparisons between different laser scanning systems. This characteristic avoids scanner transportation and the loss of productivity of systems when they are out of their working place. 

The system is supported by two tripods on the Airy points to avoid any bending, which could affect the mechanical stability. The calibration of the artifact and traceability to the national reference of length is given using the coordinate measuring machine Mitutoyo Euroc Apex 12010 under environmental controlled conditions of temperature (2072 1C) and relative humidity (50710%). 10 points are taken from each sphere surface. The sphere centre and the standard deviation are obtained using a geometric least squares fitting algorithm. The dimensions of the cubes were obtained from 10 points touched from each one of the faces, fitting through geometric least squares algorithms and the evaluation was based on the distances between planes. In both cases, the software of the machine gives all the data automatically. These measurements were performed under ENAC accreditation according ISO 17025:2005 in AIMEN Technological Centre (Vigo, Spain).


Fig. 1. Standard artifact and reference coordinate system. A code is assigned to each sphere (S1–S5) and cube (C1–C7).
Fig. 2. Terrestrial laser scanner Riegl LMS-Z390i.

2.2. El láser escáner terrestre / Terrestrial laser scanning

El láser terrestre sistema Riegl LMS-Z390i (Fig. 2) está formado por un escáner 3D rápido y preciso con el software asociado Riscan Pro. El Riegl LMS-Z390i es un sensor robusto y portátil diseñado especialmente para la adquisición rápida y precisa de imágenes tridimensionales de alta calidad y especialmente indicado para la medición de la arquitectura y la fachada, bosquejan documentación de patrimonio cultural, ingeniería civil, ciudad modelado y topografía.Las mediciones se realizan utilizando el tiempo de principio de vuelo para gama y dos codificadores angulares evaluación [26]. Tiempo de escáneres de vuelo utiliza un láser de diodo bombeado y la distancia se basa en el tiempo de vuelo de regreso de cada rayo láser. Existen otras tecnologías en el mercado basado en la diferencia de fase de la viga que viene. Tiempo de escáneres de vuelo son los más indicados para gamas grandes, pero tienen una mayor señal a ruido en breve relación y mediano alcance. Sistemas mecatrónicos de precisión se utilizan para la colocación de los espejos, que orientan el rayo láser en el campo de medición. 

Un espejo giratorio con viajes 901 se utiliza para la medición vertical y un servomotor que gira 3601 permite la exploración horizontal. La nube de puntos obtenida de las coordenadas esféricas (R, y, f) entonces se convierte directamente en coordenadas cartesianas (X, Y, Z) por el software. Además, el escáner de láser utilizado en este experimento utiliza un láser de infrarrojos clase 1, que indica que es intrínsecamente seguro y no hay ninguna posibilidad de daño de ojo. Características técnicas se muestran en la tabla 3 medida de gama está influenciado por la variabilidad del índice de refracción del aire y su relación con la velocidad de la luz. El índice de refracción cambia con las condiciones ambientales, especialmente la humedad relativa y temperatura. Riegl software integra la ecuación Edlen para corregir los resultados en el alcance de medida [27].Así, para un escáner correcto usuarios de operación deben medir la temperatura y humedad relativa e integrarlas en el software para hacer una corrección directa de datos de rango.

The terrestrial laser scanning system Riegl LMS-Z390i (Fig. 2) is formed by an accurate and fast 3D scanner with the associated software Riscan Pro. The Riegl LMS-Z390i is a rugged and fully portable sensor especially designed for the rapid and accurate acquisition of high-quality three-dimensional images and specially indicated for architecture and facade measurement, archaeology and cultural heritage documentation, civil engineering, city modelling and topography. Measurements are performed using the time of flight principle for range and two encoders for angular evaluation [26]. Time of flight scanners use a diode pumped laser and the distance is based on the return flight time of each laser beam. There are other technologies in the market based on the phase difference of the coming beam. Time of flight scanners are more indicated for large ranges, but they have a higher signal to noise ratio in short and medium range. Precision mechatronics systems are used for positioning the mirrors, which orientate the laser beam to the measuring field. A rotating mirror with 901 travel is used for vertical measurement and a servo motor that rotates 3601 allows horizontal scanning. The point cloud obtained from the spherical coordinates (R, y, f) is then converted directly to Cartesian coordinates (X, Y, Z) by the software. Furthermore, the laser scanner used in this experiment uses an infrared class 1 laser, which indicates that it is inherently safe and there is no possibility of eye damage. Technical characteristics are shown in Table 3. Measurement of range is influenced by the variability of the air refractive index and its relationship with speed of light. The refractive index changes with the environmental conditions, specially relative humidity and temperature. Riegl software integrates the Edlen equation to correct the results in range measurement [27]. Thus, for a correct scanner operation users must measure temperature and relative humidity and integrate them in the software to make a direct correction of range data.
Fig. 3. Point cloud of the standard artifact (10 m range and 0.0101 stepwidth).(A) Raw data and (B) cleaned data.

2.3. Metodología para la verificación / Verification methodology

A continuación se propone una metodología para la verificación de sistemas de escaneo láser.
Next a methodology for the verification of laser scanning systems is proposed.

Fig. 4. Element extraction from cleaned point cloud (10 m range and 0.0101 stepwidth). A code is assigned to each sphere (S1–S5), cube (C1–C7) and the top face of largest cube (T).
Fig. 5. Matlab algorithms applied to obtain (A) accuracy using the spheres, (B) precision using the top face of the largest cube, (C) resolution along X and Y axes (red area shows the points taken for the evaluation) and (D) resolution along Z-axis in cubes. LLY shows the length of the cube along Y-axis and LLZ along Z-axis. (For interpretation of the references to colour in this figure legend, the reader is referred to the web version of this article.)
(a) artefacto estándar utilizando un par de niveles de burbuja de nivelación. 

(b) posicionamiento de escáner de láser terrestre. Es importante colocar la unidad de detección de escáner a la misma altura que el artefacto estándar y para mantener un ángulo perpendicular entre el rayo láser y el eje x del artefacto. Una cinta métrica se utiliza para una valoración áspera de la gama entre el escáner y el artefacto

.(c) primas adquisición de nube de puntos. Incluye el artefacto y el área circundante. Este paso debe ser repetida si explorador diferentes resoluciones deben estudiarse.

(d) punto podría limpiar. Información geométrica de objetos interesantes no se quita de la nube de puntos de materia prima para hacer más comprensible para el siguiente proceso datos.

(e) los principales elementos para el proceso de la metrología se extraen los datos de nube de puntos y cada esfera y cubo se separaron en el archivo de datos globales para el tratamiento individual. El mismo procedimiento se aplica a la cara superior del cubo más grande.

(f) las coordenadas de los centros de las esferas se obtienen mediante un algoritmo de ajuste de mínimos cuadrados. Las distancias entre centros se evalúan directamente de los datos facilitados. Estos valores pueden ser directamente comparados con los obtenidos en la calibración de artefacto utilizando la máquina de medición por coordenadas. La diferencia entre valores da la precisión de los sistemas para las cuatro longitudes (valores nominales de 250, 500, 750 y 1000 mm).

(g) precisión (repetibilidad) del escáner se obtiene de la desviación estándar de un avión con un algoritmo de la cara superior del cubo más grande de montaje de mínimos cuadrados.

(h) resolución del artefacto estándar para los tres ejes coordenados X, Y y Z es evaluada usando los siete cubos extraídos de la nube de puntos. La calidad de este parámetro se comprueba mediante una fórmula común de error, que compara el valor de la máquina y el valor medido utilizando el escáner láser de medición por coordenadas. Teniendo esto en cuenta, el error puede ser expresado como 9LLX–LSX9/LSX, donde LLX es el valor de longitud medido por el láser y LSX es el valor de longitud medido por la máquina de medición para el eje x de coordenada. El mismo procedimiento debe repetirse para los ejes Y y Z. Los valores de LLX LLY provienen de los perfiles de los cubos en X y Y direcciones, respectivamente. Los valores para el eje z, LLZ, se evalúan como la distancia entre dos planos obtenidos de un algoritmo (cara superior y base del cubo) de montaje de mínimos cuadrados.


(a) Standard artifact levelling using a couple of bubble levels.


(b) Terrestrial laser scanner positioning. It is important to place the scanner sensing unit at the same height than the standard artifact and to keep a perpendicular angle between the laser beam and the artifact X-axis. A metric tape is used for a rough estimation of range between the scanner and the artifact.


(c) Raw point cloud acquisition. It includes the artifact and the surrounding area. This step must be repeated if different scanner resolutions are to be studied.


(d) Point could clean. Geometric information from non-interesting objects is removed from the raw point cloud to make data more understandable for the following processing.

(e) The main elements for the metrology process are extracted from the point cloud data and each sphere and cube is separated from the global data file for individual processing. The same procedure is applied to the top face of the largest cube.

(f) Coordinates of the spheres centres are obtained using a least squares fitting algorithm. Distances between centres are directly evaluated from the data provided. These values can be directly compared with those obtained in the artifact calibration using the coordinate measuring machine. The difference between values gives the accuracy of the systems for the four lengths (nominal values of 250, 500, 750 and 1000 mm).

(g) Precision (repeatability) of the scanner is obtained from the standard deviation of a plane obtained with a least squares fitting algorithm from the top face of the largest cube. 

(h) Resolution of the standard artifact for the three coordinate axes X, Y and Z is evaluated using the seven cubes extracted from the point cloud. The quality of this parameter is checked using a common error formula, which compares the value from the coordinate measuring machine and the value measured using the laser scanner. Taking this into account, the error can be expressed as 9LLX–LSX9/LSX, where LLX is the length value measured by the laser and LSX is the length value measured by the coordinate measuring machine for the X-axis. The same procedure must be repeated for Y and Z axes. The values for LLX and LLY come from the profiles of the cubes in X and Y directions, respectively. The values for Z-axis, LLZ, are evaluated as the distance between two planes obtained from a least squares fitting algorithm (top face and base of the cube).


Continúa en: Continue on: http://carreteras-laser-escaner.blogspot.com.es/2014/06/standard-artifact-for-geometric.html

For more information or if you prefer this article in pdf-format, contact with us:


Or, send us an e-mail.

domingo, 15 de junio de 2014

Construction KML files for GOOGLE EARTH / Construcción de archivos KML (GOOGLE EARTH)


Para construir un archivo KML

ENCABEZADO:
<?xml version="1.0" encoding="UTF-8"?><kml xmlns="http://earth.google.com/kml/2.1"><Document>

DEFINICIÓN DE LOS ICONOS:
<Style id="cuacua">
<IconStyle><Icon><href>http://DONDEESTÉ/cuacua.jpg</href> </Icon>
<scale>0.5</scale>
</IconStyle>
</Style>

NOMBRE DEL OBJETO COMPLETO A INCRUSTAR:
<name>GUITIRIZ</name>

SITUACIÓN DE PUNTOS:
<Placemark>
<name>ABELLEIRA</name><description>Cuadro</description><styleUrl>#cuacua</styleUrl>
<Point>
<coordinates>-7.827769, 43.243973</coordinates>
</Point>
</Placemark>

DESCRIPCIÓN MÁS AMPLIA: ¿CON UN CÓDIGO HTML?
<description>
<![CDATA[
<html><body> <ul> <li>unacosa</li> <li>doscosa</li> <li>trecosa</li> </ul>
</body></html>
]]>
</description>

RUTA
<Placemark>
<name>Ruta</name>
<styleUrl>#ELQUESEA</styleUrl>
<LineString> <tessellate>1</tessellate>
<coordinates>
-7.831145169149639,43.24548111003632,0 -7.829838425578537,43.24543153520305,0 -7.828802085991362,43.24596206771469,0 -7.827556559695273,43.24629794655928,0
</coordinates>
</LineString>
</Placemark>

POLÍGONO
<Placemark>
<name>Polígono</name> <styleUrl>#ELQUESEA</styleUrl>
<Polygon> <tessellate>1</tessellate>
<outerBoundaryIs> <LinearRing>
<coordinates>
-7.831434018418226,43.24545399364921,0 -7.830158331852824,43.24602676219662,0 -7.830760553640029,43.24670912547285,0 -7.831434018418226,43.24545399364921,0
</coordinates>
</LinearRing> </outerBoundaryIs>
</Polygon>
</Placemark>
PIE
</Document></kml>

domingo, 8 de junio de 2014

A little philosophy / Un poco de filosofía

¿Por qué empezamos a programar?

Hay dos motivos:
  • El primero, que podríamos denominar, el acicate serio, es debido a una necesidad. Queremos hacer que el ordenador haga un trabajo por nosotros y no encontramos un programa que lo haga.
  • El segundo, el más banal de los motivos. Porque se puede. Siempre te gusta poder hacer algo por tí mismo. Es una cuestión de orgullo.
Por este motivo se están colocando en este blog todo lo que hemos necesitado, recopilado o creado en este blog. (tambíen, reconozco hay un coco de inmodestia)

Ha habido que domar servidores, toneladas de información, crear combinaciones, transformaciones, ediciones, confrontar bases de datos, soluciones estéticas ... jugar con archivos y todo tipo de información en innumerables formatos.

Todo lo realizado tiene un poco de búsqueda por internet, estudio, esfuerzo y suerte. Y dado que bastante de esa sapiencia me la ha dado este mundo virtual es lógico devolver el favor por el equilibrio global.

De todos los temas que se exponen no se debe esperar un orden. Espero, que al menos, sea entretenido.

El primer paso para entender algo es reconocer qué es lo que no se sabe.

Hace años (muchos años) era estudiante universitario en Madrid. Tuve un profesor de estadística del cual, aunque olvidara el nombre, siempre recordaré una de sus primeras clases. Partió de la base de que si de un suceso no conocía nada, la probabilidad de que ocurriera o no sería del 50%. Ante la duda, cara o cruz. Equiparó el suceso al lanzamiento de una moneda al aire. El suceso podría repetirse otra vez; con dos caras, cara y cruz, o dos cruces de resultado, y sus probabilidades resultantes serían 1/4, 1/2, 1/4. Continuó con ello hasta llegar a un sumatorio del que dedujo la ecuación de la distribución normal (Gauss).

Desde la cara/cruz a Gauss

Billete de 10 marcos (antes del euro) con la imagen de Gauss y su célebre ecuación.
Cuando cuento esta historia me doy cuenta de que no le interesa a un altísimo porcentaje de la gente. Pero, a un pequeño número de personas, les parece apasionante que de una simple probabilidad del 50% se pueda deducir un ecuación tan importante: 

Ecuación de Gauss en los antiguos billetes de 10 marcos
Cada dos o tres años me encuentro con alguien que le interesa y disfruta la historia y a cambio me cuenta otra. El lado malo es que cada vez me canso más en tenerla que repetir doscientas veces hasta encontrar a esa persona.