TU ANUNCIO / YOUR PUBLICITY

AQUÍ PODRÍA ESTAR TU ANUNCIO: / HERE COULD BE YOUR AD E-mail
Mostrando entradas con la etiqueta GPS. Mostrar todas las entradas

sábado, 11 de noviembre de 2017

Toma de datos utilizando la estadística cartográfica

Como ya hemos visto en los dos artículos anteriores existe una posibilidad de minimizar los errores en la toma del GPS (http://carreteras-laser-escaner.blogspot.com.es/2017/09/estadistica-cartografica-el-centrado.html) y en la toma de datos de los distintos sensores de un Smartphone (o Tablet) (http://carreteras-laser-escaner.blogspot.com.es/2017/05/estadistica-cartografica.html). 

Lo que nos quedaría ahora es establecer una metodología que nos permita englobar estos conceptos y, acto seguido, tendremos que pensar en una su aplicación práctica. Este último apartado se hará a través de una app en Android.

As we have already seen in the two previous articles, there is a possibility to minimize the errors in the GPS capture (http://carreteras-laser-escaner.blogspot.com.es/2017/09/estadistica-cartografica-el-centrado.html) and in the data collection of the different sensors of a Smartphone (or Tablet) (http://carreteras-laser-escaner.blogspot.com.es/2017/05/estadistica-cartografica.html).
What we would have left now is to establish a methodology that allows us to encompass these concepts and, next, we will have to think about its practical application. This last section will be done through an Android app.


Metodología para el GPS. / Methodology for GPS.


Con la intención de minimizar el error por desplazamiento (Véase el artículo dedicado al centrado: http://carreteras-laser-escaner.blogspot.com.es/2017/09/estadistica-cartografica-el-centrado.html) lo primero será, si fueran conocidas, corregir en el momento de las primeras lecturas de coordenadas, las coordenadas reales. Esto se puede hacer de una manera muy simple. Si se conocen las coordenadas reales de un punto moveremos las coordenadas obtenidas por el Smartphone a las coordenadas reales.

Esto se puede hacer de una forma precisa, por topografía, o aproximada, conociendo de antemano cual será el punto de inicio.

With the intention of minimizing the error by displacement (See the article dedicated to the centering: http://carreteras-laser-escaner.blogspot.com.es/2017/09/estadistica-cartografica-el-centrado.html) the first thing will be , if they were known, correct at the time of the first coordinates readings, the real coordinates. This can be done in a very simple way. If we know the real coordinates of a point we will move the coordinates obtained by the Smartphone to the real coordinates.


This can be done in a precise way, by topography, or approximate, knowing in advance what the starting point.

Supongamos la segunda opción. Estamos en Pontevedra y queremos empezar la toma de datos en un punto en concreto de la ciudad:

Let's suppose the second option. We are in Pontevedra and we want to start taking data at a specific point in the city:


Utilizamos Google Earth, obteniendo para ese punto (esquina de la primera banda blanca del paso de peatones) las coordenadas UTM WGS84 (29T, 528608.36 m E, 4697816.93 m N) ó (42.432134°N, -8.652203°W). 
Si la media de las primeras medidas fueran, por ejemplo, 42,432668ºN y -8,652058ºW) bastaría con ir restando el desplazamiento: 0,000534ºN y 0,000145ºW. Para minimizar lo más posible este error deberemos tomar muchas medidas de coordenadas sin movernos de este punto.

Use Google Earth, getting to that point (corner of the first white band crosswalk) UTM WGS84 coordinates (29T, 528608.36 m E 4697816.93 m N) or (N 42.432134 °, -8.652203 ° W).

If the average of the first measurements were, for example, 42.432668ºN and -8.652058ºW) it would suffice to subtract the displacement: 0.000534ºN and 0.000145ºW. To minimize this error as much as possible we must take many measurements of coordinates without moving from this point.


Creación de la cuadrícula. / Creating the grid.


El siguiente paso será establecer la cuadrícula. Para ello, si pensamos en metros, procederemos a marcar una cuadrícula en la que cada cuadro tenga unas dimensiones superiores al error del GPS, A partir de 10x10 metros será suficiente. Si quisiéramos tomar mediciones según una cuadrícula de 100x100 metros está claro que el error debido al GPS sería ínfimo en comparación.

The next step will be to establish the grid. To do this, if we think in meters, we will proceed to mark a grid in which each frame has dimensions larger than the GPS error, from 10x10 meters it will be enough. If we take measurements according to a grid of 100x100 meters it is clear that the error due to GPS would be negligible in comparison.

En el siguiente dibujo hemos realizado una cuadrícula con el punto inicial (inferior izquierdo) con las coordenadas UTM WGS84 (29T, 528600,00 m E, 4697800,00 m N) y cada punto de intersección de la rejilla aumentando en 10 metros las coordenadas.

In the following drawing we have made a grid with the starting point (lower left) with the coordinates UTM WGS84 (29T, 528600.00 m E, 4697800.00 m N) and each point of intersection of the grid increasing the coordinates by 10 meters .


De esta manera, si las coordenadas obtenidas fueran WGS84 (29T, 528605,00 ± 5 m E, 4697805,00 ± 5m N) guardaríamos el dato de nuestro sensor en esa casilla. Vamos a funcionar como el sistema de cajas de seguridad de un banco. 

Así pues en el ejemplo de la foto necesitaremos una matriz de 8x5 donde guardar los datos de nuestros sensores.

In this way, if the obtained coordinates were WGS84 (29T, 528605.00 ± 5 m E, 4697805.00 ± 5m N) we would save the data of our sensor in that box. We are going to function as a bank's safe deposit box system.


So in the example of the photo we will need an 8x5 matrix to store the data of our sensors.

En la siguiente foto se han marcado algunos de los valores de los subíndices de la futura matriz (A) de datos. a1,1, a2,1, a8,1,... a6,2, ... a4,4,... a1,8,... a8,8.

In the next photo some of the values of the subscripts of the future data matrix (A) have been marked. a1,1, a2,1, a8,1,... a6,2, ... a4,4,... a1,8,... a8,8.


Metodología para la toma de datos / Methodology for data collection

Para la toma de datos empezaremos en primer lugar con la calibración y en segundo lugar con la recepción y archivo de datos

For the data collection we will start first with the calibration and secondly with the reception and data file


La calibración / The calibration


La única manera de calibrar una toma de medidas es comparativamente con un instrumento patrón. para ello crearemos un sistema de toma de datos y otro de contraposición con el real.
Tal como se explicara en el artículo anterior dedicado al centrado (https://carreteras-laser-escaner.blogspot.com/2017/09/estadistica-cartografica-el-centrado.html) propondre mos una relación entre una o varias mediciones comparadas entre resultados reales (instrumento patrón) y calculadas (smartphone). Esta relación podrá ser lineal, cuadrática,... directa o a través de un polinomio de aproximación por mínimos cuadrados.

The only way to calibrate a measurement is comparatively with a standard instrument. for this we will create a data collection system and another one in opposition to the real one. As explained in the previous article dedicated to the centering (https://carreteras-laser-escaner.blogspot.com/2017/09/estadistica-cartografica-el-centrado.html) we will propose a relationship between one or several comparative measurements between real results (standard instrument) and calculated results (smartphone). This relation can be linear, quadratic, ... direct or through a polynomial of approximation by least squares.

Hay que entender que, al igual que se explicara en el mencionado artículo, el resultado final será aproximado. En el ejemplo que se viera esos errores estaban en el entorno de 8dB, en el caso de una sola medida comparativa y un ajuste lineal hasta solo de 1dB en el caso de 8 puntos de comparación y un polinomio de aproximación de segundo grado.

It must be understood that, as explained in the aforementioned article, the final result will be approximate. In the example that was seen those errors were in the environment of 8dB, in the case of a single comparative measure and a linear adjustment to only 1dB in the case of 8 points of comparison and a polynomial of approximation of the second degree.


La recepción y archivo de datos / The reception and data archiving


Ahora con todo lo dispuesto ya estamos en condiciones de realizar la toma de datos conjunta. Es decir, GPS y ruido (por ejemplo)

Now with all the provisions we are already able to perform the joint data collection. That is, GPS and noise (for example)

La toma de datos puede ser simplemente andando, el GPS irá tomando datos y eligiendo la casilla (el elemento de la matriz A (ai,j). Acto seguido se tomará el dato y en la casilla se irán aportando estos valores. Para ello el elemento ai,j podría ser una pila (o en programación una clase tipo lista). en esa pila con un número de elementos indefinido podrían ir acumulándose los valores de ruido registrado (y recalibrados).

Al final del ejercicio de lectura tendríamos una matriz de pilas (o en lenguaje de programación, una variable tipo lista bidimensional)

The data collection can be simply by walking, the GPS will take data and choosing the box (the element of the matrix A (ai,j), then the data will be taken and in the box these values will be added. element ai, j could be a stack (or in programming a class type list) in that stack with an indefinite number of elements could accumulate the values of recorded noise (and recalibrated).

At the end of the reading exercise we would have a stack matrix (or in programming language, a variable type two-dimensional list)

Podríamos visualizarla, la matriz, de esta manera:
We could visualize it, the matrix, in this way:


Donde el elemento a1,1 comprende la zona cuadrada de 10x10 m comprendida ente las coordenadas WGS84 (29T, 528605,00 ± 5 m E, 4697805,00 ± 5m N) , el elemento a2,1, WGS84 (29T, 528615,00 ± 5 m E, 4697805,00 ± 5m N) y así sucesivamente.

Where the element a1,1 comprises the square area of 10x10 m comprised between the coordinates WGS84 (29T, 528605.00 ± 5 m E, 4697805.00 ± 5m N), the element a2,1, WGS84 (29T, 528615,00 ± 5 m E, 4697805,00 ± 5m N) and so on.

Si el lugar de leer los decibelios hubiéramos tomado el número de redes wifi tendíamos (traduciendo los valores de la pila de cada elemento de la matriz A por sus medias:
If instead of reading the decibels we had taken the number of wifi networks we tended (by translating the values of the stack of each element of matrix A by its means:


Véase artículo: https://carreteras-laser-escaner.blogspot.com.es/2015/05/the-discrete-gis-i-el-gis-discreto-i.html dedicado al gis-discreto.

See article: https://carreteras-laser-escaner.blogspot.com.es/2015/05/the-discrete-gis-i-el-gis-discreto-i.html dedicated to gis-discreto.


sábado, 9 de septiembre de 2017

Estadística cartográfica. El centrado.

Continúa de: / Continues from:
http://carreteras-laser-escaner.blogspot.com/2017/05/estadistica-cartografica.html

Siguiendo con el ejemplo del arquero supongamos que tenemos la siguiente situación:
Following the example of the archer, suppose that we have the following situation:


La diana de la derecha corresponderá al arquero olímpico y la de la izquierda al arquero principiante. Está claro que reduciríamos el error si desplazáramos el centro de masas de los disparos al centro de la diana. 

Cuando el valor de la unidad a evaluar es único (el centro) está claro que simplemente añadiremos un desplazamiento:

The target on the right will correspond to the Olympic goalkeeper and the one on the left to the beginner goalkeeper. It is clear that we would reduce the error if we moved the center of mass of the shots to the center of the target.

When the value of the unit to be evaluated is unique (the center) it is clear that we will simply add a displacement:

Medición buscada = Medición obtenida + desplazamiento
Measurement sought = Measurement obtained + displacement

Mb = Mo + d

Cuando en lugar de tener que ponderar un valor hay que ponderar un rango de valores 

When instead of having to weigh a value one must consider a range of values


Podemos ir complicando esta ecuación según sean más los valores a comparar. Es decir si "d" es función de la medición. d pasa  a ser d(M)
We can complicate this equation depending on the values to be compared. That is, if "d" is a function of the measurement. d happens to be d (M)

Mb = Mo + d(M)

Si comparásemos entre dos estados podríamos tener:
If we compare between two states we could have:

Mb = a·Mo + b

Entre tres estados la función más simple sería:
Among three states the simplest function would be:

Mb = a·Mo2 +b· Mo + c

Entre cuatro estados:
Among four states:

Mb = a·Mo3 + b·Mo2 + c· Mo + d

Etcétera.

Para ello, tendríamos que tomar diferentes Mi , extrapolar sus medias Mb y con respecto a varias Mo y deducir {a, b, ...}

Aumentaríamos la precisión obteniendo los polinomios de regresión en lugar de los polinomios pasantes. Claro está que tendríamos que tener más parejas [MoMb] que coeficientes.

For this, we would have to take different Mi, extrapolate their Mb means and with respect to several Mo and deduce {a, b, ...}

We would increase the precision by obtaining the regression polynomials. Of course we would have to have more partners [Mo, Mb] than coefficients.

Caso práctico, la estimación del ruido con un dispositivo Android 

Case study, estimating noise with an Android device


Empezaremos a estudiar una de las posibles mediciones que se pueden hacer con un dispositivo con Android, el ruido. Tenemos un aparato con micrófono y no es muy difícil encontrar un código en Android para realizar mediciones de ruido. Podemos ver un buen artículo en: http://androcode.es/2012/01/tutorial-medidor-de-decibelios/
We begin a study of the possible measurements can be made with an Android: noise. We have a device with a microphone and it is not very difficult to find a code in Android to make noise measurements. We can see a good article in: http://androcode.es/2012/01/tutorial-medidor-de-decibelios/

Simplificando, tenemos un clase "MediaRecorder" y una función accesible en dicha clase: ".getMaxAmplitude()". Si creamos la variable AMPLI y queremos tener el resultado en dB utilizaremos la siguiente función: 
Simplifying, we have a "MediaRecorder" class and an accessible function in that class: ".getMaxAmplitude ()". If we create the variable AMPLI and want to have the result in dB we will use the following function:
dB = 20·log10(AMPLI / 32768.0)

Resulta demasido fácil. Como siempre, no hay que creerse a la primera todo lo que dice Internet. Si se puede, hay que experimentar un poco. Basta con tener dos dispositivos diferentes para darnos cuenta de que miden diferente. Si además teneos un sonómetro calibrado veremos que tienen bastante error. De esta manera obtendremos las parejas [MoMb].

It is too easy. As always, you do not have to believe everything the Internet says. If you can, you have to experiment a bit. It is enough to have two different devices to realize that they measure differently. If you also have a calibrated sound level meter we will see that they have enough error. In this way we will obtain the pairs [Mo, Mb].

A continuación exponemos en una gráfica los resultados comparados e con dos dispositivos y un sonómetro con varias mediciones en rangos de 30 a 90 dB.
Next, we show on a graph the results compared with two devices and a calibrated sound level meter with several measurements in ranges of 30 to 90 dB.

En rojo, valores del sonómetro, en azul y verde, cada dispositivo

La fuente de ruido fue escalonandose y se hicieron las comparaciones cuando el sonómetro marcaba los valores de 35.8, 35.8, 42.1, 47.8, 51.0, 56.0, 60.2, 63.5, 66.8 y 71.2 dB.
Se tomaron 30 medidas en cada escalón.

The noise source was put to work and the comparisons were made when the sound level meter marked the values of 35.8, 35.8, 42.1, 47.8, 51.0, 56.0, 60.2, 63.5, 66.8 and 71.2 dB.
30 measurements were taken in each step.

Si nos fijamos en cualquiera de los grupos de datos y los ordenamos de mayor a menor,
If we look at any of the data groups and order them from largest to smallest,


No esperábamos que se asemejase tanto a una distribución normal.
De aquí lo más relevante, partiendo del artículo anterior sería el buscar la manera de ir disminuyendo el error.
We did not expect it to resemble a normal distribution so much.
From here the most relevant, starting from the previous article would be to find a way to decrease the error.

Errores de partida: / Starting errors:


Inicialmente estos son los errores máximos y medios de cada dispositivo (en valores absolutos)
Initially these are the maximum and average errors of each device (in absolute values)

Dispositivo 1 Dispositivo 2
              Device 1     Device 2
Error máx.: 7,37422222 8,65268813
Error medio: 2,739146563 3,020950081

Si de cada grupo de mediciones hubiéramos promediado:
If we had averaged each group of measurements:

Sonometro Disp 1 Disp 2 Error1 Error2
35,8         39,17 37,74 3,37 1,94
42,1         44,72 45,06 2,62 2,96
47,8         50,47 51,91 2,67 4,11
51,0         52,65 53,68 1,65 2,68
56,0         56,90 58,07 0,90 2,07
60,2         60,34 60,86 0,14 0,66
63,5         62,66 66,22 0,84 2,72
66,8         63,40 71,51 3,40 4,71
71,2         63,83 79,17 7,37 7,97
           Disp 1 Disp 2
Error máx.: 7,37 7,97
Error medio: 2,55   3,31

Aparentemente no parece que tengan que reducir. Pero, si se obtienen las aproximaciones polinómicas y se invierten:
Apparently it does not seem that they have to reduce. But, if polynomial approximations are obtained and reversed:


Para el dispositivo 1: / For device 1:
y = -0,0092x2 + 1,744x - 11,99 se despeja x=94.78 - raiz(8983.7429+108.69565(-11.99-y))
Para el dispositivo 2: / For device 2:
y = 0,0088x2 + 0,1473x + 22,569 se despeja x=-8.3693 + raiz(70.045487-113.6364(22.569-y))


Siendo "y" los valores de la tabla anterior y colocando como "x" los de la nueva tabla, se obtiene:
Being "y" the values of the previous table and placing "x" those of the new table, you get:

Sonometro    Disp 1 disp2 Error1 Error2
sound level meter
35,8         36,27 33,98 0,48 1,82
42,1         41,67 42,87 0,42 0,77
47,8         47,93  49,97 0,13 2,18
51,0         50,53  51,67 0,46 0,68
56,0         56,10 55,69 0,10 0,31
60,2         61,28  58,12 1,08 2,08
63,5         65,28  62,55 1,78 0,94
66,8         66,69 66,67 0,10 0,13
71,2         67,52 72,26  3,68 1,06
Disp 1 Disp 2
Error máx.: 3,68 2,18
Error medio: 0,92 1,11

Hemos pasado de grandes errores de casi 8dB (recordemos la escala logarítmica de los decibelios) a errores de 1dB. Para ello hemos tomado 30 mediciones en cada valor de ruido y realizado una aproximación con un polinomio de regresión de grado 2.
We have gone from big errors of almost 8dB (remember the logarithmic scale of the decibels) to 1dB errors. For this we have taken 30 measurements in each noise value and performed an approximation with a regression polynomial of degree 2.

Para este artículo nos hemos aprovechado de la capacidad de las hojas de cálculo de calcular rápidamente los polinomios de regresión.
For this article we have taken advantage of the ability of spreadsheets to quickly calculate regression polynomials.


jueves, 18 de mayo de 2017

Estadistica cartográfica. Consideraciones en la toma de datos GPS con smartphone para creación de mapas.

Hoy en día, cualquier dispositivo con Android (teléfono móvil o tablet) tiene distintos sensores, así como GPS. Estas cualidades le hacen ser versátiles en cuanto a la toma de datos (ruido, vibración, luminiscencia...) y su conexión con la posición GPS.
El problema reside en la inexactitud del GPS, pudiendo tener errores de varios metros. De la necesidad de reducir estos errores y de la posibilidad de reducirlos es el argumento de éste y los siguientes artículos.

Today, any Android device (mobile phone or tablet) has different sensors and GPS. These qualities make it versatile in terms of data collection (noise, vibration, luminescence ...) and its connection with the GPS position.
The problem is the inaccuracy of GPS, can have errors of several meters. The need to reduce these errors and the possibility of reducing them is the argument of this and the following articles.

Primera consideración. / First consideration.


No queriendo entrar de lleno en formulaciones matemáticas complejas he preferido ir paso a paso. Ya llegaremos al resultado final. Hoy veremos el problema del arquero y de reiteración con ejemplos de grupos de bolas.

I do not want to start with complex mathematical formulations. I prefer to go step by step. We will reach the final result later. Today we will see the problem of the goalkeeper and reiteration with examples of groups of balls.

El problema del arquero / The problem of the goalkeeper


El enunciado es el siguiente: Supongamos dos arqueros. El primero, campeón olímpico, El segundo, un principiante. 
Si nos formulan la siguiente pregunta: Con un intento el primero y 10 intentos el segundo ¿Por cual deberíamos apostar? Seguramente nos decantaríamos por el primero.
Si la pregunta fuera: Con un intento el primero y 10.000 intentos el segundo ¿Por cual deberíamos apostar? Seguramente cambiaríamos la respuesta por el segundo.
Pero... la pregunta difícil sería ¿A partir de cuantos intentos del segundo deberíamos decantarnos por éste?
Y otra pregunta difícil sería: si el error medio del primer arquero al centro de la diana es de 5 cm, dado un error medio X del segundo arquero ¿Cuantos intentos debería hacer el segundo para que el error medio fuera de 5cm?

Son preguntas más difíciles de responder de lo que pudiéramos pensar en un primer momento. Por ese motivo vamos antes a resolver un problema más sencillo con una estadística más discreta.

The statement is as follows: We have two archers. The first, Olympic champion, The second, a beginner.
If you ask the following question: With one try the first and 10 tries the second Why should we bet? Surely we would opt for the first.
If the question were: With one try the first and 10,000 tries the second Why should we bet? Surely we would change the answer for the second.
But ... the difficult question would be: From how many attempts of the second should we opt for this one?
And another difficult question would be: if the average error of the first goalkeeper at the center of the target is 5 cm, given an average error X of the second goalkeeper How many attempts should the second make for the average error to be 5cm?

These are more difficult questions to answer than we might think at first. For this reason we are going to solve a simpler problem with a more discrete statistic.

El problema con grupos de bolas / The problem with groups of balls


Sea un número de bolas pequeño. por ejemplo 3. para identificarlas las numeraremos: {1,2,3}
La primera pregunta será: ¿Cual será la probabilidad de sacar, al menos, un "1"?
Es demasiado sencillo: P = 0.3333333 (1/3) (Una posibilidad entre tres posibles).

With a small number of balls. for example 3. we can identify them with numbers: {1,2,3}
The first question will be: What will be the probability of getting at least a "1"?
It's too simple: P = 0.3333333 (1/3) (A possibility among three possibilities)


Compliquemos el problema, Si realizamos el experimento dos veces ¿cual será la probabilidad de obtener, al menos un "1"? (Poco a poco el problema se irá pareciendo al del arquero con el numero de intentos)

Será más fácil ver la respuesta si vemos todo el conjunto de posibilidades:
Let's complicate the problem. If we perform the experiment twice, what will be the probability of obtaining, at least a "1"? (The problem will be similar to that of the archer with the number of attempts)
It will be easier to see the answer if we see the whole set of possibilities.

5 posiblidades entre 9 = 2/9= 0.55555555
5 possibilities and 9 options = 2/9 = 0.55555555

Si realizamos el experimento tres veces ¿cual será la probabilidad de obtener, al menos un "1"? 
Veamos de nuevo el conjunto de posibilidades:

If we perform the experiment three times, what will be the probability of obtaining, at least a "1"?
Let's look again at the set of possibilities:


19 posiblidades entre 27 = 19/27= 0,7037037
19 possibilities and 27 options = 19/27 = 0.7037037

Ahora podemos encontrar la clave. Para el numerador:
Now we can find the key. For the numerator:


Y, para el denominador, sencillamente, potencias de 3
And, for the denominator, simply, powers of 3

Así, de Pa P8So, from P1 to P8:

P1 = 0,333333333
P2 = 0,555555556
P3 = 0,703703704
P4 = 0,802469136
P5 = 0,868312757
P6 = 0,912208505
P7 = 0,941472337
P8 = 0,960981558

En este punto podemos hacer un poco de magia, aplicando teoría de conjuntos La fórmula de unión de dos sucesos sería:
At this point we can do some magic, applying set theory. The joining formula of two events would be:

P(AB) = P(A) + P(B) - P(AB)
PP1+P1 - P1·P1 = 2P1 - P12 = 2·0,33333-0,333332  = 0,555555
P2P2 - P22 = 2·0,55555-0,555552  = 0,802469136  
P2P4 - P42 = 2·0,812469-0,8124692  = 0,960981558


P2P√m - P√m2

Esto nos permite encontrar la relación entre el comjunto de "m" intentos uno anterior "m"
This allows us to find the relation between the set of "m" attempts one previous "√m"

Más difícil será encontrar la función directa:  
More difficult will be to find the direct function:

P=1-(1-1/3)n

ó

P=1-(1-P1)n

ó la que a mí, estéticamente, más me gusta
or the one that, aesthetically, I like the most

1- P(1-P1)n

Ésta última ecuación resulta bastante lógica si  en nuestro problema en lugar de enunciarlo como ¿Cual es la probabilidad del suceso tal en un intento, o en dos,... o en "n"? lo enunciamos como ¿Cual es la probabilidad del no-suceso en un intento y en dos y, ... en "n"?

Esta forma de pensar no por el suceso Pn , si no por su opuesto On (= 1-Pn) la repetiremos en el futuro. (con el suceso opuesto la fórmula quedaría: O= O1n).

This last equation is quite logical if our problem instead of stating it: What is the probability of the event such in an attempt, or in two, ... or in "n"? we enunciate it as What is the probability of non-happening in one attempt and in two and, ... in "n"?


This way of thinking not by the event Pn, but by its opposite On (= 1-Pn) we will repeat it in the future. (with the opposite event the formula would be: On = O1n).

Volviendo al arquero / Going back to the goalkeeper


Supongamos que el arquero olímpico tiene una probabilidad del 95% de hacer diana y el segundo arquero tiene una probabilidad del 5% 
Suppose that the Olympic goalkeeper has a 95% chance of making a target and the second goalkeeper has a 5% chance


Podremos apostar que a 59 intentos o más empieza a tener más posibilidades de diana el segundo arquero.
We can bet that in 59 attempts or more starts to be more likely to target the second goalkeeper.

También podríamos resolverlo analíticamente: 
We could also solve it analytically:

0.95 1-(1-0.05)n
1-0.95=(1-0.05)n
log(0.05)=n log(0.95)
n=log(0.05)/log(0.95)=58.4039 

Primera conclusión: / First conclusion:


La primera conclusión que podemos tener es que por mucho error que tengamos en una medición. Si ésta se toma muchas veces, este error podría minimizarse hasta donde queramos.

En próximas entregas veremos como encontrarle utilidad a ésto. Sobre todo, con el GPS. y también veremos que otros condicionantes tendrán que cumplirse.

The first conclusion we can have is that no matter how much error we have in a measurement. If this is taken many times, this error could be minimized as far as we want.

In future installments we will see how to find utility to this. Above all, with GPS. and we will also see that other conditions will have to be fulfilled.

Continúa en: / Continue on:
https://carreteras-laser-escaner.blogspot.com/2017/09/estadistica-cartografica-el-centrado.html

Véase también: / See also:
https://carreteras-laser-escaner.blogspot.com/2017/11/toma-de-datos-utilizando-la-estadistica.html


sábado, 2 de julio de 2016

ABK BIM Módulo 3


ABK_BIM_MÓDULO_3 Es el tercer módulo (de 5) liberado de nuestro sistema BIM. No tiene todas las funcionalidades de éste, por lo que sólo funcionará su faceta de geolocalización y generación de informes, pero está adaptado para funcionar de forma independiente para su uso como asistente a la inspección en obra.
ABK_BIM_MÓDULO_3 It is the third module (of 5) released from our BIM system. It does not have all the functionalities of this one, reason why only its facet of geolocation and generation of reports will work, but it is adapted to function independently for its use like assistant to the inspection in civil works.

YA NO ESTÁ DISPONIBLE EN GOOGLE PLAY STORE, DISPONIBLE BAJO DEMANDA A AQUELLAS PERSONAS O EMPRESAS QUE CONTACTEN CON NOSOTROS.

Introducción / Introduction

Hay varias maneras de entender un sistema de información geográfica ligado a una base de datos para conseguir una estructura tipo BIM.
Para comprender nuestra filosofía puede comenzar por leer con los trabajos realizados hace años con la estructura GIS y su gestor documental asociado (ver  http://carreteras-laser-escaner.blogspot.com.es/2015/01/optimization-methodology-to-be-applied.html)

También pude leer nuestra crítica al sistema BIM actual:
https://carreteras-laser-escaner.blogspot.com/2017/05/metodologia-bim-en-la-obra-civil-o-mas.html
O la crítica de otros:

There are several ways to understand a geographic information system linked to a database to get a BIM-like structure.
In order to understand our philosophy, you can start by reading the work done years ago with the GIS structure and its associated document manager (see  http://carreteras-laser-escaner.blogspot.com.es/2015/01/optimization-methodology-to-be-applied.html)


Nuestra estructura BIM contiene los siguientes módulos:

1.- Creación de la base BIM(y/o GIS),
2.- Creación de nodos de información
3.- Toma de datos. inspecciones en obra, ensayos y control documental
4.- Creación de gestión cruzada de información
5.- Gestión cruzada de consultas 

Our BIM structure contains the following modules:

1.- Creation of the BIM base (and / or GIS),
2.- Creation of information nodes
3.- Data collection. On-site inspections, testing and documentary control
4. Creation of cross-information management
5.- Cross-management queries

La idea es poder adaptar estos módulos al Sistema de Calidad de cada empresa y mejorar la gestión de éstos. Otros sistemas suelen penalizar la gestión de datos y crear sistemas paralelos al Manual de Calidad de la empresa. Nuestra idea es que nuestro sistema ABK-BIM no sólo no incremente los costos debido a la complejidad del sistema BIM sino que éstos disminuyan.
De cara al cliente, nuestro sistema cruzado de consultas se adapta a las consultas tipo del cliente simplificando sus objetivos.
Todo esto complica el sistema y hace "sufrir" a los ordenadores obligándoles a seguir nuestras pautas en contraposición a los típicos formalismos que fuerzan las bases de datos. Nuestra fuerza está en hacer que el trabajo de oficina (la creación y gestión de informes) lo realice el ordenador o cualquier otro dispositivo.

The idea is to be able to adapt these modules to the Quality System of each company and improve their management. Other systems often penalize data management and create parallel systems to the company's Quality Manual. Our idea is that our ABK-BIM system not only does not increase costs due to the complexity of the BIM system, but these will decrease.
From the client's perspective, our cross-queries system adapts to client-type queries by simplifying its objectives.
All this complicates the system and punish computers by forcing them to follow our guidelines as opposed to the typical formalities that force databases. Our strength is in making office work (the creation and management of reports) performed by the computer or any other device.

El módulo 3 que hemos liberado en Google Play está preparado para ser independiente y sólo muestra lo que se puede hacer en un Sistema de Calidad típico de la obra civil. Sólo contiene las inspecciones de obra. Hemos eliminado el control de ensayos y el gestor documental ya que el Manual de Calidad de cada empresa y las necesidades de cada Dirección de Obra son muy variables. Esta variabilidad no lo es tanto n lo relativo a las inspecciones de obra.
También hemos eliminado la base de datos tradicional por el sistema de archivos para poder mostrar la información a la vista y hacerlo compatible con todos los dispositivos. Así, además, es más fácil intervenir con el sistema desde cualquier explorador de archivos.

La programación se ha hecho en Android para que la inspección en obra pueda realizarse con el teléfono móvil.

The module 3 that we have released on the Google Play Store is ready to be independent and only shows what can be done in a Quality System typical of the civil work. It only contains the work inspections. We have eliminated the control of tests and the documentary manager since the Quality Manual of each company and the needs of each Direction of Work are very variable. This variability is not so much as regards construction inspections.
We have also deleted the traditional database by the file system to be able to display the information in sight and make it compatible with all devices. Thus, it is easier to intervene with the system from any file browser.

Programming has been done on Android so that the on-site inspection can be done with the mobile phone.

Permisos necesarios: / Required permissions:

  • Se usará la cámara para las fotografías,
  • El acceso al sistema de archivos,
  • El GPS para geolocalizar la inspección.
  • Eventualmente se podrá utilizar el acceso a Internet para visualizar en punto con Google Maps.
  • La pantalla no se apagará automáticamente. De esta forma se evita que se pierda la información si tardamos en documentar la inspección. Por ello, cierre el programa tras cada inspección para ahorrar batería.

  • The camera will be used for photographs,
  • Access to the file system,
  • The GPS to geolocalize the inspection.
  • Eventually internet access can be used to display in point with Google Maps.
  • The screen will not turn off automatically. This way, we will avoid wasting information if we delay in documenting the inspection. Therefore, close the program after every inspection to save battery.

Funcionamiento / How does it work

Pasamos a explicar cómo funciona:

Primera apertura:
Nada más instalar y abrir por primera vez nuestro programa aparecerán los siguientes pantallazos:

Let's explain how it works:

First opening:
As soon as we install and open for the first time our program will appear the following screenshots:


Cuando nos pregunte por obra nueva, podremos dar el nombre por el que se conozca nuestra obra: "A-222; Tramo: Villa Arriba - Villa Abajo" por ejemplo.
Acto seguido nos pedirá el nombre de un código. Una recomendación es que sea la clave por la que se conozca a la obra. En nuestro ejemplo "Pru-123"
La siguiente vez que se acceda al programa nos aparecerá la siguiente pantalla:

When you ask us for a new work, we can give the name by which our work is known: "A-222; Section: Villa Arriba - Villa Abajo" for example.
He will then ask us for the name of a code. One recommendation is that it be the key by which the work is known. In our example "Pru-123"
The next time the program is accessed, the following screen will appear:


En este momento podremos elegir la obra o crear una nueva, siguiendo los pasos anteriores.

En nuestro dispositivo se habrán producido los siguientes cambios en nuestro sistema de archivos:

At this moment we can choose the work or create a new one, following the previous steps.

In our device the following changes will have occurred in our file system:


Se crearán los siguientes directorios:
The following directories will be created:

  • Abakal
  • Abakal/GIS
  • Abakal/GIS/bd
  • Pru
  • Pru/16/12/20
Explicación / Explanation
  • Abakal: Nombre de nuestro patrocinador. De esta manera quedan separados los datos de nuestra aplicación del resto de nuestro dispositivo. Si se tubiera que hacer limpieza, bastaría con eliminar este directorio y se borrarían todos los datos del programa. (Y el de todos los programs de Abakal)
  • Abakal/GIS: Drectorio de trabajo para nuestra aplicación.
  • Abakal/GIS/bd: Base de datos de todas las inpecciones a previstas inicialmente.
  • Abakal/Gis/Logo.png: 
  • Pru: Para esto se usó el código. Por este motivo resulta imprescindible que carezca de símbolos raros (como "/") y que sólo contenga números, letras, guiones pero nada más.
  • Pru/16/12/20: Si estuviéramos a 20 de diciembre de 2016 se crearía este esquema de archivos. Dentro del 16 estarán los datos del año 2016, dentro del 12, los datos de diciembre y dentro de 20 estarán los datos correspondientes a las inspecciones del 20-12-2016. 

  • Abakal: Name of our sponsor. This way the data of our application are separated from the rest of our device. If you were to clean, delete this directory and erase all program data. (And all of Abakal's programs)
  • Abakal / GIS: Directory of work for our application.
  • Abakal / GIS / bd: Database of all investigations initially planned.
  • Abakal / Gis / Logo.png:
  • Pru: For this code was used. For this reason, it is imperative that there be no rare symbols (such as "/") and only contain numbers, letters, hyphens, but nothing more.
  • Pru / 16/12/20: If we were on December 20, 2016 this file scheme would be created. Within 16 will be the data for the year 2016, within 12, the data for December and within 20 will be the data corresponding to the inspections of 20-12-2016
También se crearán los archivos: 
The following files will also be created:

  • Abakal/GIS/Logo.png.
  • Abakal/GIS/Obras.txt
  • Y dentro de Abakal/GIS/bd estarán los siguientes archivos:

  • Abakal / GIS / Logo.png.
  • Abakal / GIS / Obras.txt
  • And within Abakal / GIS / bd will be the following files:


Explicación: / Explication:

  • Logo.png por defecto será el logo de ABAKAL:
  • Logo.png by default will be the ABAKAL logo:


Las dimensiones son 893 x 204. Si queremos colocar nuestro logo sólo tenemos que substituir este archivo por el nuestro con las mismas o proporcionales dimensiones. No os paseis con las dimensiones. Si el archivo del logo fuera muy grande podríais provocar un error de OUT OF MEMORY o que los pdfs creados en los informes pesaran demasiado.

Dimensions are 893 x 204. If we place our logo only have to replace this file for ours with the same or proportional dimensions. Do not put a logo with very large dimensions. If the logo file was too large you could cause an OUT OF MEMORY error or the pdfs created in the reports will weigh too much.

  • Abakal/GIS/Obras.txt: Es un archivo de texto que contien la siguiente información:
  • Abakal / GIS / Obras.txt: It is a text file containing the following information:
Nombre de la obra
Pru-123

Es decir, las parejas nombre/código de cada obra que hayamos creado. Es editable y podemos modificar directamente el nombre si quisiéramos.
That is, the name / code couples of each work that we have created. It is editable and we can directly modify the name if we would like.
  • Cada uno de los archivos contiene un cuestionario para realizar durante la inspección. Así por ejemplo el archivo "410 Encofrado del hormigón.dat" es un archivo de texto en formato UTF-8 con el siguiente contenido (que son los diferentes puntos de inspección del encofrado):
  • Each of the files contains a questionnaire to perform during the inspection. For example the file "410 Concrete Formwork.dat" is a text file in UTF-8 format with the following content (which are the different inspection points of the formwork):
Control del replanteo
Comprobación de la geometría del conjunto
Calidad del encofrado
Estanqueidad
Verticalidad y alineación
Rigidización y apuntalamiento
Limpieza de formas encofradas
Desencofrante
Elementos auxiliares

Por supuesto, en este directorio se pueden eliminar archivos, corregirse o incorporarse otros nuevos hasta tener nuestra base de datos de inpecciones personalizada. Las únicas condiciones es que sean guardadas en texto UTF-8 y con la extensión ".dat". Si no se guardan en UTF-8 saldrán mal las tildes y las eñes.

Con este sistema de archivos hemos eliminado la necesidad de crear un laborioso programa adicional de gestión de la base de datos, logos y obras. Toda la información está a la vista con un simple gestor de archivos.

Of course, in this directory you can delete files, correct or incorporate new ones until you have our database of personalized inspections. The only conditions are that they be saved in UTF-8 text and with the extension ".dat". If they are not saved in UTF-8, the tildes and eñes will go wrong.

With this file system we have eliminated the need to create a laborious additional program of management of the database, logos and works. All the information is in view with a simple file manager.

Cómo crear una inspección: / How to create an inspection:

Añadiendo la localización: / Adding location:


Cuando vamos a incorporar una nueva inspección las coordenadas que lee del GPS están coloreadas en rojo y el botón superior izquierdo tien el texto "FIJA" si pulsamos sobre él el programa no buscará más coordenadas y dejará fijadas éstas.
Otra posibilidad si tenemos opción de datos/internet es pulsar sobre el botón "GM" localizado en la parte superior derecha. Se nos abrirá una pantalla con Google Maps. Podremos movernos sobre el mapa y situarnos donde queramos. Un pulsación prolongada sobre el mapa cambiará nuestro punto de geolocalización. Pulsando después en "Volver" trasladará estas coordenadas a nuestro anterior paso (Quedarán coloreadas en gris).

When we are going to incorporate a new inspection the coordinates that read of the GPS are colored in red and the upper left button has the text "FIXED" if we click on it the program will not look for more coordinates and will leave fixed these.
Another possibility if we have data / internet option is to click on the "GM" button located in the upper right. It will open a screen with Google Maps. We can move on the map and place wherever we want. A long press on the map will change our geolocation point. Clicking on "Back" will move these coordinates to our previous step (they will be colored in gray).

Añadiendo la fotografía: / Adding photography:

El siguiente paso es realizar la fotografía. Para ello pulsaremos en "FOTO". El programa nos traladará a la cámara de nuestro dispositivo y realizaremos la fotografía:

The next step is to take the picture. To do this, click on "PHOTO" (FOTO in spanish). The program will connect us to the camera of our device and we will make the photograph:


Añadiendo la inspección: / Adding inspection:


Pulsamos sobre el desplegable "Elija inspección" y nos aparecerán las inspecciones disponibles. Recuerde que se corresponden con los archivos .dat del directorio Abakal/bd/. Elegimos una de ellas y quedará en el cuadro de "Informes".
Ahora podemos pulsar sobre el botón "Test". Si hacemos estos nos lanzará el cuestionario incluido en el archivo .dat anteriormente mencionado y procederemos a contestar una de las tres opciones posibles: "No aplica / Conforme / No conforme". Al terminar el cuestionario quedarán reflejadas las respuestas en el recuadro "Informe".

Click on the "Choose Inspection" (Elija Inspección) drop-down and the available inspections will appear. Remember that they correspond to the .dat files in the Abakal / bd / directory. We choose one of them and it will be in the box of "Reports" (Informes).
Now we can click on the "Test" button. If we do these will send us the questionnaire included in the .dat file mentioned above and we will proceed to answer one of the three possible options: "Not applicable / Conform / Not conform." At the end of the questionnaire, the answers will be reflected in the "Report" box.

Añadiendo Observaciones: / Adding Observations:

Pulsando sobre el recuadro de observaciones nos aparecerá el siguiente diálogo:

Clicking on the observations box will show the following dialog:


Editaremos las observaciones. Ahora es buen momento para añadir la información de la parte y/o elemento inspeccionado, así como cualquier información relevante a la inspección.

We will edit the observations. Now is a good time to add the information of the part and / or element inspected, as well as any information relevant to the inspection.

Guardando los datos: / Saving data:

Una vez realizados todos estos pasos hay que guardar la inspección. HASTA ESTE MOMENTO NO HEMOS GUARDADO NADA, ¡¡ CUIDADO !! NO VAYA A PERDER LOS DATOS.
Pulsando sobre el botón "Guardar" (esquina inferior izquierda, con fondo rojo) Nos preguntará por el nombre de la unidad:

Once all these steps have been completed, the inspection must be saved. WE HAVE NOT STORED AT THIS TIME, BEWARE !! DO NOT GO TO LOSE THE DATA.
Click on the "Save" button (bottom left corner, with red background) We will ask for the name of the unit:


Transcribimos el nombre de la unidad, En nuestro ejemplo ODT 8.0, Se le da a Guardar y listo. Aparecerá toda la información de color verde. Esto significa que esa información está almacenada en nuestro dispositivo y el nombre del elemento sobreexpuesto sobre la fotografía.

We transcribed the name of the unit, In our example ODT 8.0, It is given to Save and ready. All green information will appear. This means that this information is stored in our device and the name of the element overexposed to the photograph.

Realizando una nueva inspección / Performing a new inspection

Para realizar la siguiente inspección (la número 2 de nuestro ejemplo) pulsamos donde aparece el número 1 y:
To carry out the following inspection (the number 2 of our example) we press where it appears the number 1 and:


Aparecerá un desplegable con los textos "1" y "+". Pulsamos sobre "+" y aparecerá el número 2. Repetiremos los pasos del punto anterior.

A drop-down will appear with the texts "1" and "+". Press "+" and the number 2 will appear. Repeat the steps of the previous point.

Funcionalidades: / Features:

Revisando inspecciones: / Reviewing inspections:

Las flechas nos permiten ir de una inspección a otra.
The arrows allow us to go from one inspection to another.

Revisando inspecciones realizadas en otra fecha: / Reviewing inspections carried out on another date:

Pulsando sobre el botón con la fecha actual nos aparecerá un desplegable. Elegiremos una fecha y visualizaremos los determinados en esa fecha.
Clicking on the button with the current date will appear a dropdown. We will choose a date and visualize the dates on that date.


Edición / modificación de datos / Editing / Modifying Data

Todos los datos son editables. Si realizamos cualquiera de los pasos anteriormente mencionados sobre cualquier parte de la inspección está cambiará el contenido. Cuando posteriormente demos al botón "Guardar" estos serán modificados.
NOTA: MUCHO CUIDADO CON LA EDICIÓN. SI NO SE LE DA LUEGO A "GUARDAR" NO GUARDARÁ NADA. SI SE DA A "GUARDAR" NO EXISTE LA FUNCIÓN DESHACER.

All data is editable. If we perform any of the above steps on any part of the inspection, the content will change. When we later give the button "Save" these will be modified.
NOTE: VERY CAREFUL WITH THE EDITION. IF YOU DO NOT GIVE UP TO "SAVE" YOU WILL NOT KEEP ANYTHING. IF YOU HAVE TO "SAVE" THE FUNCTION DOES NOT EXCEED.

Informes PDF / PDF Reports

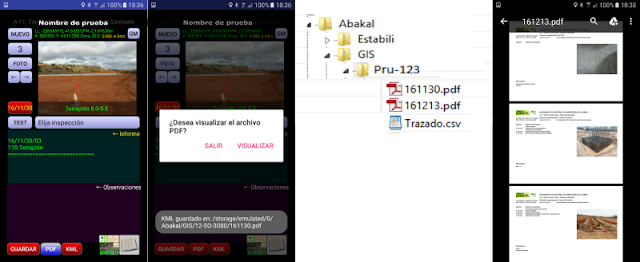
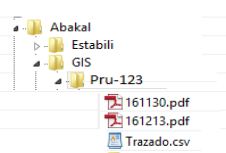
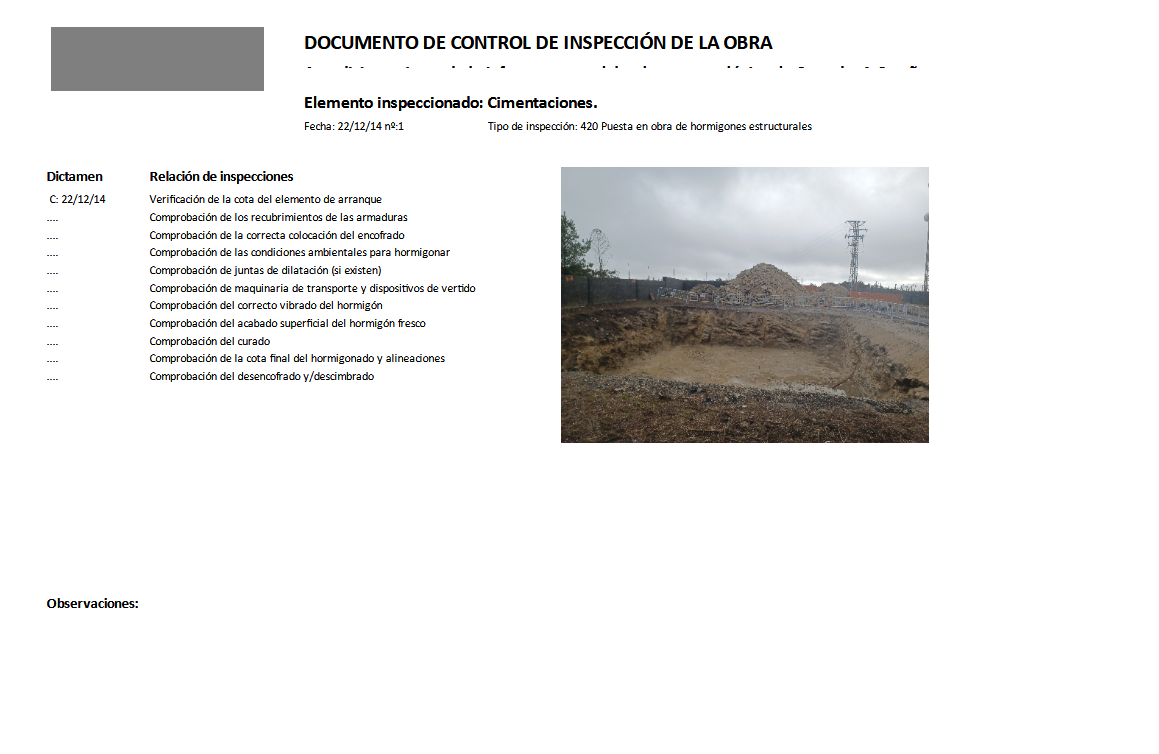
Pulsando sobre el botón PDF se nos generará el informe en PDF. Éste estará alojado en el directorio del código de nuestra obra con el nombre de la fecha de las inspecciones:

Clicking on the PDF button will generate the report in PDF. This will be housed in the directory of the code of our work with the name of the date of the inspections:


Informes KML / KML Reports

Ídem que en caso anterior. La única diferencia es que el archivo exportado es en formato KML y por tanto visualizable en Google Earth
Idem than in the previous case. The only difference is that the exported file is in KML format and therefore viewable in Google Earth


NOTA: Para visualizar el archivo aammdd.kml recuerde que tiene que adherir el árbol de directorios aa/mm/dd/ que es donde están alojadas las fotografías que se requerirán.
NOTE: To view the file aammdd.kml remember that you must adhere to the directory tree yy / mm / dd / which is where the photos that will be required are housed.

Datos añadibles: El trazado. / Addable data: The layout.

El programa puede "adivinar" en que punto kilométrico estamos si previamente se le ha dado una tabla con los pks, Coordenada X, Coordenada Y
Esta tabla será un archivo denominado Trazado.csv, es de la forma:

The program can "guess" in which point we are located if we have previously been given a table with the pks, X coordinate, Y coordinate
This table will be a file named Trazado.csv, it is of the form:


0;504587,3229;4608731,864
20;504604,1678;4608742,646
40;504621,0126;4608753,427
60;504637,8575;4608764,21
80;504654,7024;4608774,992
100;504671,5472;4608785,774
120;504688,3921;4608796,556
140;504705,237;4608807,338
160;504722,0818;4608818,12
[...]

y lo guardamos en el directorio Abakal/CodigoObra/Trazado.csv. Deben estar en el sistema de coordenadas geográficas UTM WGS-84.
NOTA: Cuidado con usar otro tipo de sistemas de coordenadas geográficas como ED-50. Se usa WGS-84 porque es la que entiende Google Maps y así ser coherente con él, al tiempo que es la más internacional.
Este dato aparecerá en amarillo al lado de las coordenadas.

And save it in the Abakal / CodeOpen / Path.csv directory. They must be in the WGS-84 UTM geographical coordinate system.
NOTE: Be careful with using other types of geographic coordinate systems such as ED-50. WGS-84 is used because it is the one that understands Google Maps and thus be consistent with it, while it is the most international.
This will appear in yellow next to the coordinates.

Consultas por concepto / Consultations by concept


Si pulsáramos sobre el botón "x Título" haremos una búsqueda de los datos según el elemento a buscar (el título de cada informe). Nos aparecerá un diálogo con un desplegable para elegir el elemento a buscar. Después el programa procederá a la búsqueda de las inpecciones relacionadas:

If we click on the "x Title" button we will search the data according to the item to be searched (the title of each report). We will see a dialog with a drop-down box to choose the item to look for. Then the program will proceed to the search for related inpections:


En el estado de consultas por concepto:
  • No se pueden modificar datos
  • Desaparecerá el botón de guardar
  • Se podrán hacer informes en PDF
  • Se podrán hacer informes en Google Earth.
In the status of queries by concept:

  • Can not modify data
  • The save button will disappear
  • PDF reports can be made
  • Reports can be made in Google Earth.

Conclusiones: / Conclusions:

Como hemos visto esta herramienta nos permite situarnos en la obra, realizar una fotografía, adosarla una inspección, geolocalizarla, editarla fácilmente, realizar informes en PDF y geolocalizados en formato de Google Earth (KML).
Se observa el potencial inherente en este tipo de gestión de datos. Futuras búsquedas por conceptos, adhesión de ensayos, datos de proyecto, etc.
El resto de los módulos no los podemos liberar ya que son muy específicos para cada empresa y su sistema de gestión de la calidad.

As we have seen this tool allows us to situate ourselves in the work, make a photograph, attach an inspection, geolocalize it, edit it easily, make PDF reports and geolocated in Google Earth (KML) format.
The potential inherent in this type of data management is observed. Future searches by concepts, adhesion of essays, project data, etc.
The rest of the modules can not be released because they are very specific for each company and its quality management system.


NUEVO EN LA VERSIÓN 4: / NEW IN VERSION 4:

Hemos añadido un botón con el carácter "Σ". Su función es la de hacer resúmenes y así crear tanto el parte diario como el histórico de cada unidad de ejecución:

El resultado será una pareja de archivos: Diario.html y Resumen.html (Se guardarán dentro del directorio de la obra)

We have added a button with the character "Σ". Its function is to make summaries and thus create both the daily and the historical part of each unit of execution:

The result will be a couple of files: Diario.html and Abstract.html (will be stored in the directory of the work)


Se ha optado por el formato html porque todo el mundo tiene un visor de html en el móvil. Es fácilmente editable y utilizable con nuestro editor de texto u hoja de cálculo preferida.
Desde aquí quisiéramos agradecer a María Piñeiro que nos pidiera esta funcionalidad. Esperamos que sea de su agrado y el de todos ustedes.


NUEVO EN LA VERSIÓN 7: / NEW IN VERSION 7:

Hemos añadido un botón con el nombre "E/T". Su función es la de hacer la gráfica de espacios / tiempos y de las inspecciones y exportarla en formato DXF (compatible con CAD) y PNG (Más burdo pero más apto para transcribir en informes.

We have added a button named "E/T". Its function is to make space/time summary graphs in format DXF (for CAD) and PNG to be incorporates to reports

Desde aquí quisiéramos agradecer a Carlos Oswald que nos pidiera esta funcionalidad. Esperamos que sea de su agrado y el de todos ustedes.

From here we would like to thank Carlos Oswald for requesting this functionality. We hope it is to your liking and that of all of you.

DXF:


PNG:


NOTA: Para disponer de esta funcionalidad tiene que estar agregado el fichero  Trazado.csv
NOTE: To have this functionality must be added the file Trazado.csv


NUEVO EN LA VERSIÓN 9: / NEW IN VERSION 9:

Hemos unido una posible conexión con el programa Photo-Report (véase: Photo Report / Reportaje fotográfico / Rapport photographique)

Al realizar el informe KML se guardarán las fotografías con el nombre de [ Orden + Elemento + PK .jpg ] en el directorio ".../fotos" para que pueda ser utilizado con el programa PhotoReport y realizar montajes fotográficos de resumen.

We have linked a possible connection with the Photo-Report program (see: Photo Report / Reportaje fotográfico / Rapport photographique)

When making the KML report, the photographs with the name of [Order + Element + PK .jpg] will be saved in the "... / photos" directory so that it can be used with the PhotoReport program and perform summary photo montages.


NUEVO EN LA VERSIÓN 14: / NEW IN VERSION 14:

Se ha incluido la exportación de espacios tiempos en 3 Dimensiones, dos espaciales y una temporal. La cota Z corresponderá a 25 cms por unidad de tiempo (días desde la 1ª inspección).

It has included the export of 3-dimensional space-time, two spatial and one temporary. The Z coordinate will correspond to 25 cms per unit of time (days from the 1st inspection).

Es más fácil verlo en el siguiente gif animado:
It is easier to see it in the following animated gif:


En el caso de guardar los datos en formato kmz la fotografía estará colocada a x metros de altura. Siendo x los días transcurridos desde la primera inspección. Quedan abiertas las opciones de no usar tal altura temporal y la de escalar la transcripción de días por cotas.

In the case of saving the data in kmz format, the photograph will be placed at x meters high. Where x is the days since the first inspection. Options are open not use such temporary climbing height and transcription levels of days.


Las escalas se guardarán en un nuevo archivo denominado ../Abakal/GIS/alturas.dat que contendrá inicialmente los valores de
       0.25
       1.0

 The scales will be saved in a new file called ../Abakal/GIS/alturas.dat that will initially contain the values of
        0.25
        1.0

NUEVO EN LA VERSIÓN 20: / NEW IN VERSION 20:

Se ha incluido el dimensionado de la foto y el tipo de fuente (calibrí), mas nítido cuando se realiza el pdf.
Aparecerá un nuevo archivo denominado "Encuadre.txt" con los siguientes datos por defecto:
    Escala:
    2500
    Ancho x alto:
    400    
    300
    X e Y iniciales:
    400
    150


Si, por ejemplo se varía la escala y el ancho x alto:
    Escala:
    300
    Ancho x alto:
    300    
    288
    X e Y iniciales:
    400
    150

Quedaría así:
La foto es más pequeña (ancho x alto) y mas pixelada (escala: 300). El primer pdf pesará unos 4-10MB y el segundo unos 300-400 KB. Aunque el primer pdf sea tan grande y, si un mes tuviera por ejemplo 40 inspecciones, se podría pensar que el documento final compuesto tendría unos 400MB. Ciertamente es muy pesado. Pero, como está claro Adobe® sabe más de pdfs que nadie. Si al abrir este documento se vuelve a imprimir en AdobePDF o en PDF de formato reducido, se disminuye el peso en 100 veces.